
PUBLISHER: Global Market Insights Inc. | PRODUCT CODE: 1667078

PUBLISHER: Global Market Insights Inc. | PRODUCT CODE: 1667078
Concrete Surface Retarders Market Opportunity, Growth Drivers, Industry Trend Analysis, and Forecast 2025 - 2034
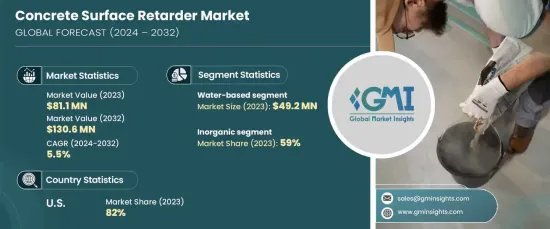
The Global Concrete Surface Retarders Market, valued at USD 81.1 million in 2023, is expected to grow at a CAGR of 5.5% between 2024 and 2032. This growth is fueled by the rapid pace of urbanization and infrastructure development in emerging economies, driving the need for advanced construction materials. Concrete surface retarders have become essential for creating aesthetically appealing and functional surfaces in construction projects. Their ability to enhance concrete finishes has increased their adoption across various applications in residential and commercial construction sectors.
Concrete surface retarders play a vital role in delivering textured surfaces and exposed aggregate finishes, which are in high demand due to the rising popularity of decorative concrete. These products are widely used to meet the growing trend for innovative architectural designs, where achieving visually appealing concrete surfaces is a priority. The use of retarders allows precise control over the surface texture, enabling contractors to achieve consistent and high-quality finishes that enhance the overall aesthetic value of structures.
| Market Scope | |
|---|---|
| Start Year | 2024 |
| Forecast Year | 2025-2034 |
| Start Value | $81.1 Million |
| Forecast Value | $130.6 Million |
| CAGR | 5.5% |
In terms of product type, water-based concrete surface retarders accounted for approximately USD 49.2 million in 2023 and are projected to grow at a CAGR of around 5.7% through 2032. These products are preferred for their safer composition, as they do not emit harmful fumes or require extensive safety measures during application. With increasing awareness of occupational health and safety, contractors are favoring water-based options as a more sustainable and worker-friendly alternative to solvent-based retarders.
From a material perspective, the inorganic segment held a dominant 59% market share in 2023 and is expected to grow at a CAGR of 5.2% over the forecast period. Inorganic surface retarders are known for their superior performance under challenging environmental conditions, such as high temperatures or dry weather, where they effectively extend concrete workability. This makes them highly suitable for large-scale construction projects and specialized applications requiring high-performance materials.
In 2023, the U.S. led the market with an 82% share, driven by growing interest in decorative concrete solutions. The demand for visually appealing and cost-effective construction materials has contributed significantly to the adoption of concrete surface retarders in this region. As homeowners, builders, and architects seek innovative finishing solutions, the market for these products continues to expand, supported by the rising focus on durable and attractive concrete surfaces.
Table of Contents
Chapter 1 Methodology & Scope
- 1.1 Market scope & definitions
- 1.2 Base estimates & calculations
- 1.3 Forecast calculations.
- 1.4 Data sources
- 1.4.1 Primary
- 1.4.2 Secondary
- 1.4.2.1 Paid sources
- 1.4.2.2 Public sources
Chapter 2 Executive Summary
- 2.1 Industry synopsis, 2021-2032
Chapter 3 Industry Insights
- 3.1 Industry ecosystem analysis
- 3.1.1 Factor affecting the value chain.
- 3.1.2 Profit margin analysis.
- 3.1.3 Disruptions
- 3.1.4 Future outlook
- 3.1.5 Manufacturers
- 3.1.6 Distributors
- 3.2 Supplier landscape
- 3.3 Profit margin analysis.
- 3.4 Key news & initiatives
- 3.5 Regulatory landscape
- 3.6 Impact forces
- 3.6.1 Growth drivers
- 3.6.1.1 Growing construction industry
- 3.6.1.2 Growing demand for specialty applications
- 3.6.2 Industry pitfalls & challenges
- 3.6.2.1 Market saturation and intense competition
- 3.6.2.2 Sustainability concerns
- 3.6.1 Growth drivers
- 3.7 Growth potential analysis
- 3.8 Porter’s analysis
- 3.9 PESTEL analysis
Chapter 4 Competitive Landscape, 2023
- 4.1 Introduction
- 4.2 Company market share analysis
- 4.3 Competitive positioning matrix
- 4.4 Strategic outlook matrix
Chapter 5 Market Estimates & Forecast, By Type, 2021-2032 (USD Million) (Million liters)
- 5.1 Key trends
- 5.2 Water based
- 5.3 Solvent based
Chapter 6 Market Estimates & Forecast, By Material, 2021-2032 (USD Million) (Million liters)
- 6.1 Key trends
- 6.2 Organic agent
- 6.3 Inorganic agent
Chapter 7 Market Estimates & Forecast, By End-use, 2021-2032 (USD Million) (Million liters)
- 7.1 Key trends
- 7.2 Residential
- 7.3 Commercial
Chapter 8 Market Estimates & Forecast, By Distribution Channel, 2021-2032 (USD Million) (Million liters)
- 8.1 Key trends
- 8.2 Direct
- 8.3 Indirect
Chapter 9 Market Estimates & Forecast, By Region, 2021-2032 (USD Million) (Million liters)
- 9.1 Key trends
- 9.2 North America
- 9.2.1 U.S.
- 9.2.2 Canada
- 9.3 Europe
- 9.3.1 UK
- 9.3.2 Germany
- 9.3.3 France
- 9.3.4 Italy
- 9.3.5 Spain
- 9.3.6 Russia
- 9.4 Asia Pacific
- 9.4.1 China
- 9.4.2 India
- 9.4.3 Japan
- 9.4.4 South Korea
- 9.4.5 Australia
- 9.5 Latin America
- 9.5.1 Brazil
- 9.5.2 Mexico
- 9.6 MEA
- 9.6.1 UAE
- 9.6.2 Saudi Arabia
- 9.6.3 South Africa
Chapter 10 Company Profiles
- 10.1 Arkema
- 10.2 BASF
- 10.3 Cemex
- 10.4 Chryso
- 10.5 Fosroc International
- 10.6 GCP Applied Technologies
- 10.7 Koster Bauchemie
- 10.8 LATICRETE International
- 10.9 Mapei
- 10.10 MBCC Group
- 10.11 RPM International
- 10.12 Schlumberger
- 10.13 Sika
- 10.14 The Euclid Chemical Company
- 10.15 W. R. Grace

