
PUBLISHER: Global Market Insights Inc. | PRODUCT CODE: 1913358

PUBLISHER: Global Market Insights Inc. | PRODUCT CODE: 1913358
Virtual Production Market Opportunity, Growth Drivers, Industry Trend Analysis, and Forecast 2026 - 2035
The Global Virtual Production Market was valued at USD 2.9 billion in 2025 and is estimated to grow at a CAGR of 21.1% to reach USD 18.5 billion by 2035.
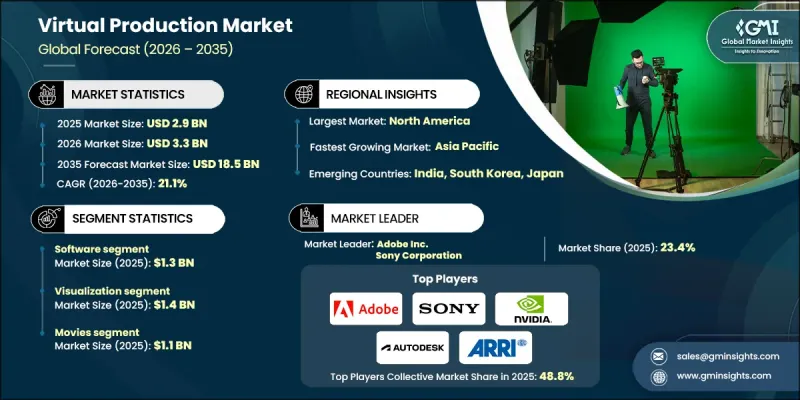
The market is being propelled by the rising adoption of VFX in film production, increased use of virtual technologies in commercials, and the growing integration of LED wall technology in virtual production studios. AI-driven content creation within virtual environments and the demand for gaming content are further accelerating growth. The industry is being reshaped by LED wall technology, allowing studios to create photorealistic digital environments that can be dynamically adjusted in real time, eliminating the need for extensive physical sets or multiple shooting locations. This innovation enhances creative flexibility, dramatically reduces production time and costs, and allows filmmakers to produce vast, immersive worlds with greater efficiency, fundamentally transforming the speed and scalability of content creation.
| Market Scope | |
|---|---|
| Start Year | 2025 |
| Forecast Year | 2026-2035 |
| Start Value | $2.9 Billion |
| Forecast Value | $18.5 Billion |
| CAGR | 21.1% |
The software segment generated USD 1.3 billion in 2025. Growth is fueled by the rising demand for advanced VFX tools, real-time rendering solutions, and AI-enabled software applications. Firms are focusing on delivering improved real-time rendering, enhancing automation with AI, and developing scalable software solutions for the entertainment, gaming, and advertising sectors to meet growing demand.
The full live LED wall segment is expected to grow at a CAGR of 25.3% during 2026-2035. The rising need for immersive, changeable backgrounds in virtual productions is driving this growth, as full live LED walls eliminate the costs and time associated with physical sets while providing realistic, adaptable environments.
U.S. Virtual Production Market reached USD 991.4 million in 2025, driven by the country's thriving entertainment industry, technology adoption, and demand for innovative solutions in film, gaming, and advertising. Companies are concentrating on advancing virtual production technologies, enhancing VFX capabilities, and tailoring offerings to meet specific needs within the U.S. market.
Key players in the Global Virtual Production Market include Adobe Inc., Sony Corporation, NVIDIA Corporation, Autodesk Inc., ARRI AG, Epic Games Inc., FuseFX, HTC Corporation, Insta360, Pixotope, BORIS FX, Inc., and Mo-Sys Engineering Ltd. To strengthen their market position, companies in the Global Virtual Production Market focus on continuous innovation in AI-enhanced VFX, real-time rendering, and LED wall technologies. They invest in R&D to create scalable, efficient solutions that reduce production time and costs while enhancing creative flexibility. Strategic collaborations with studios, gaming companies, and advertising agencies expand their client base, while acquisitions of niche technology providers enable access to complementary expertise. Firms also prioritize expanding regional presence, offering tailored solutions, and providing robust customer support to build long-term partnerships and solidify their competitive edge in an evolving global market.
Table of Contents
Chapter 1 Methodology and scope
- 1.1 Market scope and definition
- 1.2 Research design
- 1.2.1 Research approach
- 1.2.2 Data collection methods
- 1.3 Data mining sources
- 1.3.1 Global
- 1.3.2 Regional/Country
- 1.4 Base estimates and calculations
- 1.4.1 Base year calculation
- 1.4.2 Key trends for market estimation
- 1.5 Primary research and validation
- 1.5.1 Primary sources
- 1.6 Forecast model
- 1.7 Research assumptions and limitations
Chapter 2 Executive summary
- 2.1 Industry 3600 synopsis
- 2.2 Key market trends
- 2.2.1 Component trend
- 2.2.2 Type trends
- 2.2.3 End use trends
- 2.2.4 Regional trends
- 2.3 TAM Analysis, 2026-2035 (USD Million)
- 2.4 CXO perspectives: Strategic imperatives
- 2.4.1 Executive decision points
- 2.4.2 critical success factors
- 2.5 Future outlook and strategic recommendations
Chapter 3 Industry insights
- 3.1 Industry ecosystem analysis
- 3.1.1 Supplier landscape
- 3.1.2 Profit margin
- 3.1.3 Cost structure
- 3.1.4 Value addition at each stage
- 3.1.5 Factor affecting the value chain
- 3.1.6 Disruptions
- 3.2 Industry ecosystem analysis
- 3.3 Industry impact forces
- 3.3.1 Growth drivers
- 3.3.1.1 Increasing demand for visual effects (VFX) in movie production studios
- 3.3.1.2 Rising applications of virtual production in commercial ads
- 3.3.1.3 Growing Implementation of LED wall technology
- 3.3.1.4 Growing implementation of AI in virtual production
- 3.3.1.5 Growing demand for virtual production in gaming
- 3.3.2 Pitfalls and challenges
- 3.3.2.1 Lack of skilled professionals
- 3.3.2.2 High capital expenditure and initial setup
- 3.3.3 Market opportunities
- 3.3.3.1 Advancements in real-time rendering technology
- 3.3.3.2 Expansion of virtual production in TV and streaming
- 3.3.1 Growth drivers
- 3.4 Growth potential analysis
- 3.5 Regulatory landscape
- 3.5.1 North America
- 3.5.2 Europe
- 3.5.3 Asia Pacific
- 3.5.4 Latin America
- 3.5.5 Middle East & Africa
- 3.6 Porter's analysis
- 3.7 PESTEL analysis
- 3.8 Technology and Innovation landscape
- 3.8.1 Current technological trends
- 3.8.2 Emerging technologies
- 3.9 Emerging Business Models
- 3.10 Compliance Requirements
- 3.11 Sustainability Measures
- 3.12 Consumer Sentiment Analysis
- 3.13 Patent and IP analysis
- 3.14 Geopolitical and trade dynamics
Chapter 4 Competitive landscape, 2025
- 4.1 Introduction
- 4.2 Company market share analysis
- 4.2.1 By region
- 4.2.1.1 North America
- 4.2.1.2 Europe
- 4.2.1.3 Asia Pacific
- 4.2.1.4 Latin America
- 4.2.1.5 Middle East & Africa
- 4.2.2 Market concentration analysis
- 4.2.1 By region
- 4.3 Competitive benchmarking of key players
- 4.3.1 Financial performance comparison
- 4.3.1.1 Revenue
- 4.3.1.2 Profit margin
- 4.3.1.3 R&D
- 4.3.2 Product portfolio comparison
- 4.3.2.1 Product range breadth
- 4.3.2.2 Technology
- 4.3.2.3 Innovation
- 4.3.3 Geographic presence comparison
- 4.3.3.1 Global footprint analysis
- 4.3.3.2 Service network coverage
- 4.3.3.3 Market penetration by region
- 4.3.4 Competitive positioning matrix
- 4.3.4.1 Leaders
- 4.3.4.2 Challengers
- 4.3.4.3 Followers
- 4.3.4.4 Niche players
- 4.3.5 Strategic outlook matrix
- 4.3.1 Financial performance comparison
- 4.4 Key developments, 2021-2024
- 4.4.1 Mergers and acquisitions
- 4.4.2 Partnerships and collaborations
- 4.4.3 Technological advancements
- 4.4.4 Expansion and investment strategies
- 4.4.5 Sustainability initiatives
- 4.4.6 Digital transformation initiatives
- 4.5 Emerging/ startup competitors landscape
Chapter 5 Market estimates and forecast, by Component, 2022 - 2035 (USD Billion)
- 5.1 Key trends
- 5.2 Hardware
- 5.3 Software
- 5.4 Services
Chapter 6 Market estimates and forecast, by Type, 2022 - 2035 (USD Million)
- 6.1 Key trends
- 6.2 Visualization
- 6.2.1 Pitchvis
- 6.2.2 Previs
- 6.2.3 Virtual scouting
- 6.2.4 Techvis
- 6.2.5 Stuntvis
- 6.2.6 Postvis
- 6.3 Performance capture
- 6.4 Hybrid Green Screen Live
- 6.5 Full Live LED Wall
Chapter 7 Market estimates and forecast, by End Use, 2022 - 2035 (USD Million)
- 7.1 Key trends
- 7.2 Movies
- 7.3 TV series
- 7.4 Commercial ads
- 7.5 Online videos
- 7.6 Broadcasting studios
- 7.6.1 News broadcasting
- 7.6.2 Sports broadcasting entertainment shows
- 7.6.3 Entertainment shows
- 7.6.4 Weather & traffic studios
- 7.6.5 Political & financial commentary
- 7.6.6 Live event broadcasting
- 7.6.7 Education & public service channels
- 7.7 Others
Chapter 8 Market estimates and forecast, by Region, 2022 - 2035 (USD Million)
- 8.1 Key trends
- 8.2 North America
- 8.2.1 U.S.
- 8.2.2 Canada
- 8.3 Europe
- 8.3.1 Germany
- 8.3.2 UK
- 8.3.3 France
- 8.3.4 Spain
- 8.3.5 Italy
- 8.3.6 Netherlands
- 8.4 Asia Pacific
- 8.4.1 China
- 8.4.2 India
- 8.4.3 Japan
- 8.4.4 Australia
- 8.4.5 South Korea
- 8.5 Latin America
- 8.5.1 Brazil
- 8.5.2 Mexico
- 8.5.3 Argentina
- 8.6 Middle East and Africa
- 8.6.1 Saudi Arabia
- 8.6.2 South Africa
- 8.6.3 UAE
Chapter 9 Company profiles
- 9.1 Global Key Players
- 9.1.1 Adobe Inc.
- 9.1.2 Sony Corporation
- 9.1.3 NVIDIA Corporation
- 9.1.4 Epic Games Inc.
- 9.2 Regional Key Players
- 9.2.1 North America
- 9.2.1.1 Autodesk Inc.
- 9.2.1.2 FuseFX
- 9.2.1.3 Mo-Sys Engineering Ltd.
- 9.2.2 Europe
- 9.2.2.1 ARRI AG
- 9.2.2.2 BORIS FX, INC
- 9.2.3 Asia-Pacific
- 9.2.3.1 HTC Corporation
- 9.2.3.2 Insta360
- 9.2.1 North America
- 9.3 Disruptors / Niche Players
- 9.3.1 Pixotope

