
PUBLISHER: Global Market Insights Inc. | PRODUCT CODE: 1716649

PUBLISHER: Global Market Insights Inc. | PRODUCT CODE: 1716649
Artificial Intelligence as a Service (AIaaS) Market Opportunity, Growth Drivers, Industry Trend Analysis, and Forecast 2025 - 2034
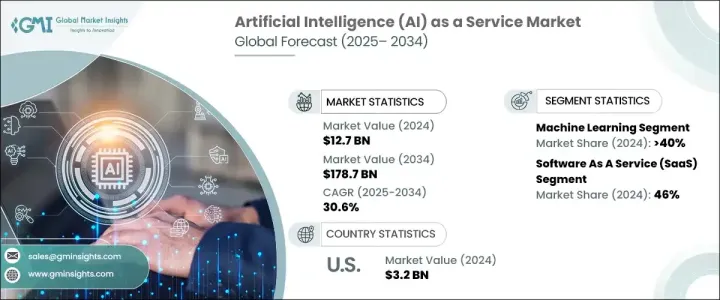
The Global Artificial Intelligence as a Service Market was valued at USD 12.7 billion in 2024 and is expected to grow at a CAGR of 30.6% between 2025 and 2034. As AI becomes a cornerstone of digital transformation, businesses across industries are rapidly embracing AIaaS solutions to remain competitive and agile. The rising demand for automation, data-driven decision-making, and enhanced customer experiences is fueling the widespread adoption of AIaaS platforms. These solutions allow companies to access advanced AI tools without building expensive in-house infrastructure, making AI integration more feasible and scalable.
AIaaS platforms are revolutionizing industries by helping businesses streamline processes, optimize operations, and reduce human intervention in repetitive tasks. As AI capabilities advance, more companies are leveraging AIaaS to develop innovative applications, personalize customer interactions, and gain real-time insights for better decision-making. Enterprises are increasingly seeking AIaaS providers that offer flexible, cost-efficient models to address a growing range of use cases-from intelligent chatbots and fraud detection to predictive analytics and supply chain optimization. The growing emphasis on digitalization and the need for continuous innovation have positioned AIaaS as a critical enabler of business growth and operational excellence, attracting both large enterprises and small to mid-sized businesses.
| Market Scope | |
|---|---|
| Start Year | 2024 |
| Forecast Year | 2025-2034 |
| Start Value | $12.7 Billion |
| Forecast Value | $178.7 Billion |
| CAGR | 30.6% |
The primary factor driving the AIaaS market's growth is the rising demand for automation across various industry verticals. AIaaS gives organizations the essential tools to enhance productivity, optimize customer service, manage large data volumes efficiently, and reduce operational costs. As businesses look for smarter ways to improve performance and streamline operations, the demand for AIaaS platforms continues to surge. The expanding market for industrial automation and control systems is further accelerating the adoption of AI-driven technologies. Companies across sectors such as healthcare, retail, finance, manufacturing, and logistics are embracing AIaaS to automate key functions like customer support, data entry, inventory management, and more, thereby improving efficiency and driving innovation.
The AIaaS market is segmented by technology into machine learning (ML), natural language processing (NLP), computer vision, and others. Among these, the machine learning segment dominated with a 40% share, generating USD 5 billion in 2024. ML forms the backbone of numerous AI applications, including recommendation engines, fraud detection systems, predictive analytics, and process automation. Its adaptability across multiple industries makes ML an indispensable part of AIaaS offerings, as companies seek to unlock deeper insights and automate decision-making.
In terms of offerings, the market is divided into infrastructure as a service, platform as a service, and software as a service (SaaS). The SaaS segment led with a 46% market share in 2024, providing businesses with subscription-based access to powerful AI tools without the high upfront investment of on-premises solutions. SaaS models offer unparalleled scalability and flexibility, making AI adoption more accessible for organizations of all sizes, further propelling AIaaS market growth.
North America held a 34% share of the global AIaaS market in 2024. The U.S. stands out with its advanced cloud computing ecosystem, which serves as a backbone for AIaaS deployment. Leading U.S.-based providers offer robust, scalable cloud platforms that enable businesses to seamlessly integrate AI solutions, driving down costs and expanding access to cutting-edge AI tools across industries.
Table of Contents
Chapter 1 Methodology & Scope
- 1.1 Research design
- 1.1.1 Research approach
- 1.1.2 Data collection methods
- 1.2 Base estimates & calculations
- 1.2.1 Base year calculation
- 1.2.2 Key trends for market estimation
- 1.3 Forecast model
- 1.4 Primary research and validation
- 1.4.1 Primary sources
- 1.4.2 Data mining sources
- 1.5 Market scope & definition
Chapter 2 Executive Summary
- 2.1 Industry 3600 synopsis, 2021 - 2034
Chapter 3 Industry Insights
- 3.1 Industry ecosystem analysis
- 3.2 Supplier landscape
- 3.2.1 AIaaS Providers
- 3.2.2 Technology integrators and consultants
- 3.2.3 End Use
- 3.3 Profit margin analysis
- 3.4 Technology & innovation landscape
- 3.5 Patent analysis
- 3.6 Key news & initiatives
- 3.7 Regulatory landscape
- 3.8 Impact forces
- 3.8.1 Growth drivers
- 3.8.1.1 Advancements in AI technologies
- 3.8.1.2 Increasing demand for automation
- 3.8.1.3 Improved cost efficiency and scalability
- 3.8.1.4 Rising cloud adoption
- 3.8.1.5 Growing need for personalized customer experiences
- 3.8.2 Industry pitfalls & challenges
- 3.8.2.1 Data privacy and security concerns
- 3.8.2.2 Lack of in-house expertise
- 3.8.1 Growth drivers
- 3.9 Growth potential analysis
- 3.10 Porter's analysis
- 3.11 PESTEL analysis
Chapter 4 Competitive Landscape, 2024
- 4.1 Introduction
- 4.2 Company market share analysis
- 4.3 Competitive positioning matrix
- 4.4 Strategic outlook matrix
Chapter 5 Market Estimates & Forecast, By Technology, 2021 - 2034 ($Bn)
- 5.1 Key trends
- 5.2 Machine Learning (ML)
- 5.3 Computer vision
- 5.4 Natural Language Processing (NLP)
- 5.5 Others
Chapter 6 Market Estimates & Forecast, By Cloud Type, 2021 - 2034 ($Bn)
- 6.1 Key trends
- 6.2 Public
- 6.3 Hybrid
- 6.4 Private
Chapter 7 Market Estimates & Forecast, By Organization Size, 2021 - 2034 ($Bn)
- 7.1 Key trends
- 7.2 SME
- 7.3 Large enterprise
Chapter 8 Market Estimates & Forecast, By Offering, 2021 - 2034 ($Bn)
- 8.1 Key trends
- 8.2 Infrastructure as a service
- 8.3 Platform as a service
- 8.4 Software as a service
Chapter 9 Market Estimates & Forecast, By Industry Vertical, 2021 - 2034 ($Bn)
- 9.1 Key trends
- 9.2 Banking, Financial, and Insurance (BFSI)
- 9.3 Healthcare and Life Sciences
- 9.4 Retail
- 9.5 IT & Telecommunication
- 9.6 Government and defense
- 9.7 Manufacturing
- 9.8 Energy & Utility
- 9.9 Others
Chapter 10 Market Estimates & Forecast, By Region, 2021 - 2034 ($Bn)
- 10.1 Key trends
- 10.2 North America
- 10.2.1 U.S.
- 10.2.2 Canada
- 10.3 Europe
- 10.3.1 UK
- 10.3.2 Germany
- 10.3.3 France
- 10.3.4 Italy
- 10.3.5 Spain
- 10.3.6 Russia
- 10.3.7 Nordics
- 10.4 Asia Pacific
- 10.4.1 China
- 10.4.2 India
- 10.4.3 Japan
- 10.4.4 Australia
- 10.4.5 South Korea
- 10.4.6 Southeast Asia
- 10.5 Latin America
- 10.5.1 Brazil
- 10.5.2 Mexico
- 10.5.3 Argentina
- 10.6 MEA
- 10.6.1 UAE
- 10.6.2 South Africa
- 10.6.3 Saudi Arabia
Chapter 11 Company Profiles
- 11.1 Alibaba Cloud
- 11.2 Amazon Web Services
- 11.3 Baidu Cloud
- 11.4 BigML
- 11.5 C3.ai
- 11.6 Datarobot
- 11.7 Fair Isaac
- 11.8 Google
- 11.9 H2O.ai
- 11.10 IBM
- 11.11 Intel
- 11.12 Iris.ai
- 11.13 Meta AI
- 11.14 Microsoft
- 11.15 NVIDIA
- 11.16 Oracle
- 11.17 Salesforce
- 11.18 SAP
- 11.19 Siemens
- 11.20 Palantir
- 11.21 Yellow.ai

