
PUBLISHER: Global Market Insights Inc. | PRODUCT CODE: 1666625

PUBLISHER: Global Market Insights Inc. | PRODUCT CODE: 1666625
Directed Energy Weapons Market Opportunity, Growth Drivers, Industry Trend Analysis, and Forecast 2025 - 2034
The Global Directed Energy Weapons Market is poised for substantial growth, reaching USD 6.7 billion in 2024, with an impressive projected expansion at a CAGR of 17.6% from 2025 to 2034. This surge is fueled by advancements in precision targeting, along with a rising demand for innovative and high-tech defense systems. DEWs, including high-energy lasers and microwave-based systems, offer a powerful and efficient means of neutralizing threats. These systems provide unmatched speed and precision, allowing for quick reaction times and operational efficiency. They represent a significant shift in modern military strategies, offering cost-effective, low-collateral-damage solutions for countering diverse threats, such as drones, missiles, and advanced weaponry. As the world's security landscape evolves, the growing need for rapid, precise defense solutions is making DEWs an essential tool in national security arsenals. With technological innovations and a clear demand for enhanced military capabilities, the market is set to transform defense strategies globally.
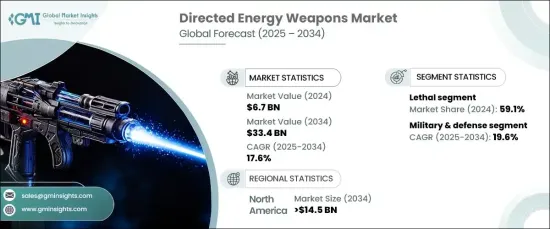
The market is divided into lethal and non-lethal DEWs, with lethal systems dominating the sector in 2024, accounting for 59.1% of the market share. These advanced weapons are designed to swiftly eliminate or disable targets with minimal collateral damage. The ability of lethal DEWs to strike at the speed of light is invaluable in countering fast-moving threats like drones, missiles, and hostile weaponry. This precision reduces risks while providing military forces with a reliable and powerful tool for modern combat. Lethal systems also stand out for their reduced operational costs per shot, enhancing their strategic value. The lethal segment will continue to lead, driven by the increasing need for fast-response capabilities in an era of rapid technological advancements.
| Market Scope | |
|---|---|
| Start Year | 2024 |
| Forecast Year | 2025-2034 |
| Start Value | $6.7 Billion |
| Forecast Value | $33.4 Billion |
| CAGR | 17.6% |
In terms of application, the military and defense sector is the fastest-growing segment of the market, with a projected CAGR of 19.6% during the forecast period. The integration of DEWs across naval, ground, and aerial platforms is revolutionizing military operations. These systems' ability to neutralize threats like drones, precision-guided munitions, and missile attacks gives the armed forces a significant tactical edge. Their scalability, rapid targeting, and precision make them indispensable for both offensive and defensive operations, driving their increasing adoption in modern military strategies.
North America is expected to generate USD 14.5 billion in directed energy weapon sales by 2034, leading the global market. This dominance is supported by strong government investments, a robust private sector, and ongoing technological innovations. The region is home to major players and innovation hubs, which accelerate the development of DEW technologies. Regulatory support and a commitment to national security ensure North America's position at the forefront of this market. As global security threats evolve, the continued advancement of directed energy weapons promises to play a crucial role in modern defense strategies worldwide.
Table of Contents
Chapter 1 Methodology & Scope
- 1.1 Market scope & definitions
- 1.2 Base estimates & calculations
- 1.3 Forecast calculations
- 1.4 Data sources
- 1.4.1 Primary
- 1.4.2 Secondary
- 1.4.2.1 Paid sources
- 1.4.2.2 Public sources
Chapter 2 Executive Summary
- 2.1 Industry synopsis, 2021-2034
Chapter 3 Industry Insights
- 3.1 Industry ecosystem analysis
- 3.1.1 Factor affecting the value chain
- 3.1.2 Profit margin analysis
- 3.1.3 Disruptions
- 3.1.4 Future outlook
- 3.1.5 Manufacturers
- 3.1.6 Distributors
- 3.2 Supplier landscape
- 3.3 Profit margin analysis
- 3.4 Key news & initiatives
- 3.5 Regulatory landscape
- 3.6 Impact forces
- 3.6.1 Growth drivers
- 3.6.1.1 Increasing military investments in advanced defense technologies
- 3.6.1.2 Rising demand for non-lethal weapons for crowd control
- 3.6.1.3 Advancements in laser and high-energy weapon systems
- 3.6.1.4 Growing threats from drones and unmanned aerial vehicles
- 3.6.1.5 Strategic defense initiatives to counter emerging global threats
- 3.6.2 Industry pitfalls & challenges
- 3.6.2.1 High costs and financial constraints for development and deployment
- 3.6.2.2 Regulatory challenges and complexities in military applications
- 3.6.1 Growth drivers
- 3.7 Growth potential analysis
- 3.8 Porter’s analysis
- 3.9 PESTEL analysis
Chapter 4 Competitive Landscape, 2024
- 4.1 Introduction
- 4.2 Company market share analysis
- 4.3 Competitive positioning matrix
- 4.4 Strategic outlook matrix
Chapter 5 Market Estimates & Forecast, By Product Type, 2021-2034 (USD Million)
- 5.1 Key trends
- 5.2 Lethal
- 5.3 Non-lethal
Chapter 6 Market Estimates & Forecast, By Technology, 2021-2034 (USD Million)
- 6.1 Key trends
- 6.2 High energy laser
- 6.2.1 Solid-state laser
- 6.2.2 Fiber laser
- 6.2.3 Free electron laser
- 6.2.4 Chemical laser
- 6.2.5 Liquid laser
- 6.3 High-power Radio Frequency
- 6.3.1 Narrow-band microwave
- 6.3.2 Ultra-wideband microwave
- 6.4 Electromagnetic weapons
- 6.4.1 Particle beam weapons
- 6.4.2 Laser-induced plasma channel (LIPC)
- 6.5 Sonic weapons
Chapter 7 Market Estimates & Forecast, By Platform, 2021-2034 (USD Million)
- 7.1 Key trends
- 7.2 Land
- 7.2.1 Armored vehicles
- 7.2.2 Handheld
- 7.2.3 Weapon systems
- 7.3 Airborne
- 7.3.1 Helicopters
- 7.3.2 Fighter aircraft
- 7.3.3 Special mission aircraft
- 7.3.4 Tactical UAVs
- 7.4 Naval
- 7.4.1 Combat ships
- 7.4.2 Submarines
- 7.4.3 Unmanned surface vehicles
- 7.5 Space
Chapter 8 Market Estimates & Forecast, By Application, 2021-2034 (USD Million)
- 8.1 Key trends
- 8.2 Military & Defense
- 8.2.1 Border protection
- 8.2.2 Tactical missile defense
- 8.2.3 Maritime protection
- 8.2.4 Military base protection
- 8.2.5 Anti-ballistic missile defense
- 8.2.6 Anti-satellite missile defense
- 8.2.7 Command, control, and information warfare
- 8.2.8 Battlefield air interdiction
- 8.3 Homeland security
- 8.3.1 Riot control
- 8.3.2 Airport protection
- 8.3.3 Anti-drug smuggling
- 8.3.4 Critical infrastructure protection
- 8.3.5 Chemical, biological, radiological, nuclear, and explosives (CBRNE)
Chapter 9 Market Estimates & Forecast, By Region, 2021-2034 (USD Million)
- 9.1 Key trends
- 9.2 North America
- 9.2.1 U.S.
- 9.2.2 Canada
- 9.3 Europe
- 9.3.1 UK
- 9.3.2 Germany
- 9.3.3 France
- 9.3.4 Italy
- 9.3.5 Spain
- 9.3.6 Russia
- 9.4 Asia Pacific
- 9.4.1 China
- 9.4.2 India
- 9.4.3 Japan
- 9.4.4 South Korea
- 9.4.5 Australia
- 9.5 Latin America
- 9.5.1 Brazil
- 9.5.2 Mexico
- 9.6 MEA
- 9.6.1 South Africa
- 9.6.2 Saudi Arabia
- 9.6.3 UAE
Chapter 10 Company Profiles
- 10.1 BAE Systems PLC
- 10.2 Elbit Systems Ltd
- 10.3 Honeywell International Inc
- 10.4 L3Harris Technologies, Inc
- 10.5 Leonardo SpA
- 10.6 Lockheed Martin Corporation
- 10.7 Moog, Inc.
- 10.8 Northrop Grumman Corporation
- 10.9 QinetiQ Limited
- 10.10 Rafael Advanced Defense Systems Ltd.
- 10.11 Raytheon Technologies Corporation
- 10.12 Rheinmetall AG
- 10.13 Textron, Inc.
- 10.14 Thales Group
- 10.15 The Boeing Company

