
PUBLISHER: Global Market Insights Inc. | PRODUCT CODE: 1667162

PUBLISHER: Global Market Insights Inc. | PRODUCT CODE: 1667162
U.S. Air Source Heat Pump Market Opportunity, Growth Drivers, Industry Trend Analysis, and Forecast 2025 - 2034
U.S. Air Source Heat Pump Market reached USD 8.3 billion in 2024 and is projected to grow at a robust CAGR of 9.8% between 2025 and 2034. This growth is driven by the increasing adoption of energy-efficient systems for heating, cooling, and hot water applications, alongside rising consumer spending and diverse climatic conditions. Expanding commercial and residential infrastructure and a growing emphasis on enhancing the energy performance of buildings are further supporting market dynamics.
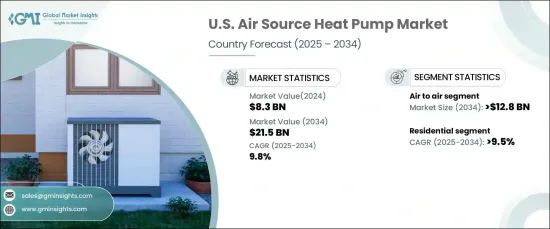
The air-to-air heat pump segment is expected to surpass USD 12.8 billion through 2034. Its growth is fueled by the demand for sustainable, low-emission solutions capable of operating efficiently in varying climates. These systems are increasingly preferred in residential applications, ensuring consistent indoor temperatures across diverse regions. Technological advancements that improve energy efficiency and government incentives, such as tax credits and subsidies promoting eco-friendly heating and cooling solutions, are boosting adoption rates.
| Market Scope | |
|---|---|
| Start Year | 2024 |
| Forecast Year | 2025-2034 |
| Start Value | $8.3 Billion |
| Forecast Value | $21.5 Billion |
| CAGR | 9.8% |
Air-to-water heat pumps are gaining traction due to technological innovations that enhance installation flexibility and operational performance. These systems offer benefits such as reduced noise levels, quicker heating times, and lower installation costs, making them an attractive choice for residential and commercial spaces. Policymakers are encouraging the adoption of these technologies through investments aimed at reducing carbon emissions and energy consumption, particularly in space heating and hot water applications.
The residential segment of the U.S. air source heat pump market is poised for a CAGR of 9.5% through 2034. Growing demand for efficient temperature control in homes and multi-unit buildings, coupled with efforts to minimize utility costs, is driving this growth. As consumers seek advanced systems that deliver both energy savings and lower carbon footprints, the adoption of air source heat pumps is accelerating. A rising population and government funding to enhance energy-efficient building infrastructure are additional factors bolstering the residential sector.
With a clear focus on sustainability, energy efficiency, and technological advancements, the U.S. air source heat pump market is set for substantial growth over the coming years. The combination of consumer demand, supportive government policies, and innovations in heat pump technology is reshaping the market, offering solutions that meet environmental goals while reducing operational costs.
Table of Contents
Chapter 1 Methodology & Scope
- 1.1 Market definitions
- 1.2 Base estimates & calculations
- 1.3 Forecast calculation
- 1.4 Data sources
- 1.4.1 Primary
- 1.4.2 Secondary
- 1.4.2.1 Paid
- 1.4.2.2 Public
Chapter 2 Industry Insights
- 2.1 Industry ecosystem analysis
- 2.2 Regulatory landscape
- 2.3 Industry impact forces
- 2.3.1 Growth drivers
- 2.3.2 Industry pitfalls & challenges
- 2.4 Growth potential analysis
- 2.5 Porter's analysis
- 2.5.1 Bargaining power of suppliers
- 2.5.2 Bargaining power of buyers
- 2.5.3 Threat of new entrants
- 2.5.4 Threat of substitutes
- 2.6 PESTEL analysis
Chapter 3 Competitive Landscape, 2024
- 3.1 Introduction
- 3.2 Strategic dashboard
- 3.3 Innovation & sustainability landscape
Chapter 4 Market Size and Forecast, By Product, 2021 – 2034 (USD Million, ‘000 Units)
- 4.1 Key trends
- 4.2 Air to air
- 4.3 Air to water
Chapter 5 Market Size and Forecast, By Application, 2021 – 2034 (USD Million, ‘000 Units)
- 5.1 Key trends
- 5.2 Residential
- 5.2.1 Single family
- 5.2.2 Multi family
- 5.2.3 By product
- 5.2.3.1 Domestic hot water heat pump
- 5.2.3.2 Room heat pump
- 5.3 Commercial
- 5.3.1 Educational institutes
- 5.3.2 Healthcare
- 5.3.3 Retail
- 5.3.4 Logistics & transportation
- 5.3.5 Offices
- 5.3.6 Hospitality
- 5.3.7 Others
Chapter 6 Company Profiles
- 6.1 American Standard
- 6.2 Bosch
- 6.3 Bard HVAC
- 6.4 Carrier
- 6.5 Colmac
- 6.6 Daikin
- 6.7 Fujitsu General
- 6.8 Gree
- 6.9 Hitachi
- 6.10 LG
- 6.11 Lennox
- 6.12 Mitsubishi Electric
- 6.13 Rheem
- 6.14 Samsung
- 6.15 Trane

