
PUBLISHER: Global Market Insights Inc. | PRODUCT CODE: 1721573

PUBLISHER: Global Market Insights Inc. | PRODUCT CODE: 1721573
Caps and Closures Market Opportunity, Growth Drivers, Industry Trend Analysis, and Forecast 2025 - 2034
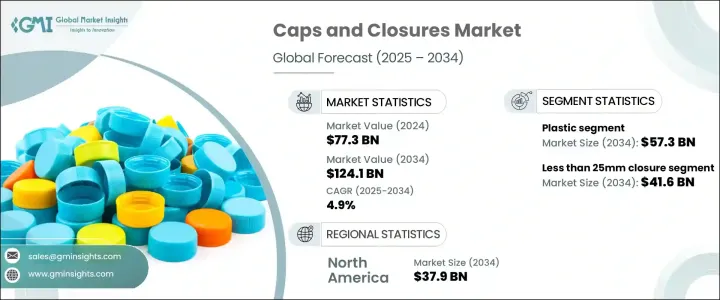
The Global Caps and Closures Market was valued at USD 77.3 billion in 2024 and is estimated to grow at a CAGR of 4.9% to reach USD 124.1 billion by 2034. This upward trend reflects the increasing importance of secure and sustainable packaging solutions across industries. As the packaging industry continues to evolve, caps and closures are playing a pivotal role in ensuring product integrity, extending shelf life, and enhancing consumer convenience. With the steady rise in global population, urbanization, and industrialization, the demand for innovative packaging that meets changing consumer needs is reaching new heights. Market participants are aligning with these shifts by investing in smart designs and materials that ensure ease of use, product protection, and environmental responsibility. As consumers lean more towards portable, resealable, and tamper-evident packaging, caps and closures are becoming indispensable in sectors like food and beverage, personal care, pharmaceuticals, and household goods. The growing prevalence of on-the-go lifestyles and the surge in e-commerce are further bolstering the need for packaging components that are both durable and functional. This industry is poised for significant advancement as companies continue to innovate and cater to emerging market demands.
The packaging sector has been a major contributor to this growth, fueled by the rising consumption of diverse food and beverage products. Caps and closures serve a crucial function in packaging by offering user-friendly features that allow easy opening and resealing. They help maintain freshness, preserve product quality, and offer an airtight barrier that safeguards contents from spoilage, contamination, and external elements. As safety and hygiene concerns mount, particularly in consumables, the relevance of high-performance closures becomes more pronounced.
| Market Scope | |
|---|---|
| Start Year | 2024 |
| Forecast Year | 2025-2034 |
| Start Value | $77.3 Billion |
| Forecast Value | $124.1 Billion |
| CAGR | 4.9% |
The market is segmented by material type, with plastic emerging as the most dominant material category. In 2024, the plastic segment generated USD 35 billion and is forecast to reach USD 57.3 billion by 2034. Plastic closures are widely favored due to their cost-effectiveness, lightweight nature, and excellent sealing properties. Materials like High-Density Polyethylene (HDPE) and Low-Density Polyethylene (LDPE) are extensively used for their low permeability, effectively blocking moisture and gases to maintain product integrity.
Among closure sizes, the "less than 25mm" category accounted for USD 23.8 billion in 2024. This segment is primarily driven by growing consumer preference for compact, single-serve packaging across food, beverages, and personal care items. These smaller closures support convenience, portion control, and mobility-traits that resonate well with modern, fast-paced lifestyles.
The North America Caps and Closures Market generated USD 26.2 billion in 2024 and is expected to hit USD 37.9 billion by 2034. The region's high disposable income, demand for packaged goods, and focus on packaging innovation are driving this steady expansion.
Key players in the global caps and closures market include Crown Holdings Inc., Amcor plc, AptarGroup Inc., Silgan Holdings Inc., Guala Closures Group, Berry Global Group Inc., Plastipak Packaging Inc., Kaufman Container, Nova-Pack, Pont Packaging, RPC Group, Frapak Packaging, Nippon Closures Co Ltd, Pano Cap, and Uchiyama Manufacturing Corp. Leading companies are prioritizing innovation, sustainability, and portfolio diversification by integrating recyclable and biodegradable materials into their product lines to meet evolving consumer and environmental expectations.
Table of Contents
Chapter 1 Methodology & Scope
- 1.1 Research design
- 1.1.1 Research approach
- 1.1.2 Data collection methods
- 1.2 Base estimates and calculations
- 1.2.1 Base year calculation
- 1.2.2 Key trends for market estimates
- 1.3 Forecast model
- 1.4 Primary research & validation
- 1.4.1 Primary sources
- 1.4.2 Data mining sources
- 1.4.2.1 Market definitions
Chapter 2 Executive Summary
- 2.1 Industry 3600 synopsis, 2021-2034
Chapter 3 Industry Insights
- 3.1 Industry ecosystem analysis
- 3.1.1 Factors affecting the value chain
- 3.1.2 Profit margin analysis
- 3.1.3 Disruptions
- 3.1.4 Future outlook
- 3.1.5 Supplier landscape
- 3.1.6 Manufacturers
- 3.1.7 Distributors
- 3.1.8 Retailers
- 3.1.9 Technology & innovation landscape
- 3.1.10 Key news & initiatives
- 3.1.11 Regulatory landscape
- 3.2 Impact forces
- 3.2.1 Growth drivers
- 3.2.1.1 Growing demand for convenience and packaging solutions
- 3.2.1.2 Growth in the food and beverage industry
- 3.2.1.3 Adoption of sustainable and eco-friendly packaging
- 3.2.1.4 Expansion of pharmaceuticals and nutraceuticals sector
- 3.2.2 Industry pitfalls & challenges
- 3.2.2.1 Fluctuations in raw material prices
- 3.2.2.2 Environmental concerns related to plastics
- 3.2.1 Growth drivers
- 3.3 Growth potential analysis
- 3.4 Pricing analysis
- 3.5 Porter’s analysis
- 3.6 PESTEL analysis
Chapter 4 Competitive Landscape, 2024
- 4.1 Introduction
- 4.2 Company market share analysis
- 4.3 Competitive positioning matrix
- 4.4 Strategic outlook matrix
Chapter 5 Market Estimates & Forecast, By Material, 2021-2034 (USD Billion) (Million Units)
- 5.1 Key trends
- 5.2 Plastic
- 5.3 Metal
- 5.4 Rubber
- 5.5 Cork
- 5.6 Glass
- 5.7 Others
Chapter 6 Market Estimates & Forecast, By Closure Size, 2021-2034 (USD Billion) (Million Units)
- 6.1 Key trends
- 6.2 Less than 25mm
- 6.3 25mm to 49mm
- 6.4 50mm to 69mm
- 6.5 70mm to 99mm
- 6.6 100mm & above
Chapter 7 Market Estimates & Forecast, By End Use, 2021-2034 (USD Billion) (Million Units)
- 7.1 Key trends
- 7.2 Pharmaceuticals and nutraceuticals
- 7.3 Food and beverages
- 7.4 Consumer goods
- 7.5 Personal care and cosmetics
- 7.6 Others
Chapter 8 Market Estimates & Forecast, By Distribution Channel, 2021-2034 (USD Billion) (Million Units)
- 8.1 Key trends
- 8.2 Direct sales
- 8.3 Indirect sales
Chapter 9 Market Estimates & Forecast, By Region, 2021-2034 (USD Billion) (Million Units)
- 9.1 Key trends
- 9.2 North America
- 9.2.1 U.S.
- 9.2.2 Canada
- 9.3 Europe
- 9.3.1 UK
- 9.3.2 Germany
- 9.3.3 France
- 9.3.4 Italy
- 9.3.5 Spain
- 9.3.6 Russia
- 9.4 Asia Pacific
- 9.4.1 China
- 9.4.2 India
- 9.4.3 Japan
- 9.4.4 South Korea
- 9.4.5 Australia
- 9.5 Latin America
- 9.5.1 Brazil
- 9.5.2 Mexico
- 9.6 MEA
- 9.6.1 South Africa
- 9.6.2 Saudi Arabia
- 9.6.3 UAE
Chapter 10 Company Profiles
- 10.1 Amcor plc
- 10.2 Crown Holdings Inc
- 10.3 AptarGroup Inc.
- 10.4 Berry Global Group Inc
- 10.5 Silgan Holdings Inc
- 10.6 Guala Closures Group
- 10.7 Plastipak Packaging Inc
- 10.8 Kaufman Container
- 10.9 RPC Group
- 10.10 Nova-Pack
- 10.11 Pont Packaging
- 10.12 Frapak Packaging
- 10.13 Pano Cap
- 10.14 Nippon Closures Co Ltd
- 10.15 Uchiyama Manufacturing Corp

