
PUBLISHER: Global Market Insights Inc. | PRODUCT CODE: 1750611

PUBLISHER: Global Market Insights Inc. | PRODUCT CODE: 1750611
Conveying Equipment Market Opportunity, Growth Drivers, Industry Trend Analysis, and Forecast 2025 - 2034
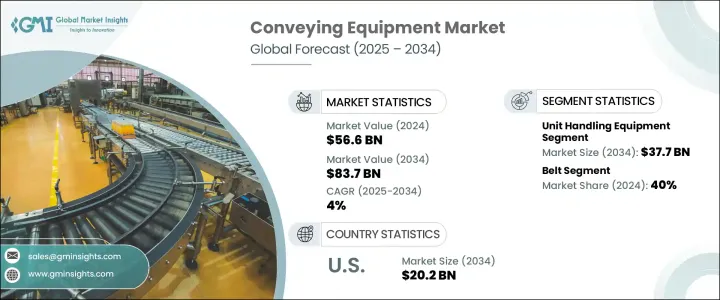
The Global Conveying Equipment Market was valued at USD 56.6 billion in 2024 and is estimated to grow at a CAGR of 4% to reach USD 83.7 billion by 2034. This steady growth is being shaped by rapid industrial development, constant innovation in automation technologies, and evolving demands within logistics and supply chain networks. As industries scale operations and adapt to more streamlined production models, the need for reliable, efficient, and intelligent conveying systems is accelerating. The rising emphasis on productivity, sustainability, and operational flexibility across sectors is creating substantial opportunities for equipment manufacturers and system integrators.
Industrial sectors such as food and beverage, automotive, mining, and pharmaceuticals are prioritizing process optimization, which includes the integration of advanced conveying solutions. These sectors demand high throughput, reduced human intervention, and enhanced safety, prompting organizations to invest in automated systems. Government support for smart manufacturing and digitization across regions is adding momentum to the adoption of modern material handling technologies. The push toward seamless operations and the ongoing labor shortages in key markets are also prompting enterprises to replace manual handling tasks with automated conveyor systems that improve accuracy and reduce downtime. As digital transformation reshapes production and warehouse environments, conveying equipment remains critical to maintaining uninterrupted material flow and reducing bottlenecks.
| Market Scope | |
|---|---|
| Start Year | 2024 |
| Forecast Year | 2025-2034 |
| Start Value | $56.6 Billion |
| Forecast Value | $83.7 Billion |
| CAGR | 4% |
In terms of product segmentation, the market is categorized into bulk handling equipment, unit handling equipment, and parts & accessories. Among these, unit handling equipment led the market in 2024 with a revenue of USD 25.5 billion and is anticipated to reach USD 37.7 billion by 2034. The fast-paced growth of this segment is attributed to the expanding e-commerce sector, increased warehousing activities, and a rise in light manufacturing operations. Unit handling systems are ideal for transporting individual items such as boxes, parcels, and containers-making them indispensable in order fulfillment centers and distribution hubs. Retailers and logistics providers are investing in advanced conveyor systems to keep pace with rising shipment volumes and tighter delivery timelines.
The adoption of unit conveyors is also expanding in sectors that require precision, hygiene, and product integrity. Industries, including pharmaceuticals, food processing, and consumer goods, are driving demand for systems that offer contamination control and cleanroom compatibility. As expectations for quality and safety standards increase, companies are turning to unit handling conveyors for their reliability and flexibility. Furthermore, growing investment in automation across postal and courier services is propelling demand for systems that can handle higher volumes with increased speed and accuracy.
Based on equipment type, the conveying equipment market is categorized into roller, belt, pallet, chain conveyors, overhead, and others. In 2024, belt conveyors accounted for 40% of the market and are projected to grow at a CAGR exceeding 4.3% through 2034. These conveyors are widely used due to their versatility and capability to transport a wide range of materials over varied distances. Their ability to operate on inclines and navigate complex terrain makes them well-suited for environments where continuous material flow is essential.
Belt conveyors have a strong presence in industries that require the constant movement of goods-whether bulk or packaged. Their role in reducing manual handling, enhancing productivity, and adapting to specific material handling needs continues to support their widespread deployment. In manufacturing and storage facilities, there is increasing interest in energy-efficient belt systems that integrate smart technologies for real-time monitoring and system optimization.
In 2024, the United States emerged as a key contributor to the global market, generating revenue of USD 13.1 billion, with projections indicating it will climb to USD 20.2 billion by 2034. The US market is benefiting from increased automation across manufacturing, warehousing, and logistics operations. With rising labor costs and the need for operational efficiency, businesses are seeking to convey systems that can minimize downtime, improve safety, and enhance throughput. As industries move toward digital integration, conveying solutions that offer predictive maintenance and real-time data tracking are becoming standard.
The shift toward reshoring and expanding domestic production is further strengthening the demand for automated material handling systems. As companies invest in modernizing facilities and enhancing logistics infrastructure, conveying equipment is playing a crucial role in supporting this transformation. Strong demand from sectors like automotive, consumer goods, and food processing continues to shape the US market outlook, with innovation and operational efficiency at the forefront of purchasing decisions.
Leading players in the global conveying equipment industry include EZ Loader, Boatmate Trailers, Hydrotrans, Kropf Industrial, Karavan Trailers, Load Rite Trailers, Midwest, Magic Tilt Trailers, TRIGANO, and Venture Trailers. These companies are focused on enhancing product capabilities through innovation and expanding their market footprint through strategic partnerships and targeted investments.
Table of Contents
Chapter 1 Methodology & Scope
- 1.1 Research design
- 1.1.1 Research approach
- 1.1.2 Data collection methods
- 1.2 Base estimates and calculations
- 1.2.1 Base year calculation
- 1.2.2 Key trends for market estimates
- 1.3 Forecast model
- 1.4 Primary research & validation
- 1.4.1 Primary sources
- 1.4.2 Data mining sources
- 1.5 Market definitions
Chapter 2 Executive Summary
- 2.1 Industry 3600 synopsis, 2021 - 2034
Chapter 3 Industry Insights
- 3.1 Industry ecosystem analysis
- 3.2 Impact of Trump administration tariffs
- 3.2.1 Trade impact
- 3.2.1.1 Trade volume disruptions
- 3.2.1.2 Retaliatory measures
- 3.2.2 Impact on industry
- 3.2.2.1 Supply-side impact (raw materials)
- 3.2.2.1.1 Price volatility in key materials
- 3.2.2.1.2 Supply chain restructuring
- 3.2.2.1.3 Production cost implications
- 3.2.2.2 Demand-side impact (Cost to customers)
- 3.2.2.2.1 Price transmission to end markets
- 3.2.2.2.2 Market share dynamics
- 3.2.2.2.3 Consumer response patterns
- 3.2.2.1 Supply-side impact (raw materials)
- 3.2.3 Key companies impacted
- 3.2.4 Strategic industry responses
- 3.2.4.1 Supply chain reconfiguration
- 3.2.4.2 Pricing and product strategies
- 3.2.4.3 Policy engagement
- 3.2.5 Outlook & future considerations
- 3.2.1 Trade impact
- 3.3 Profit margin analysis
- 3.4 Technology & innovation landscape
- 3.5 Key news & initiatives
- 3.6 Regulatory landscape
- 3.7 Impact on forces
- 3.7.1 Growth drivers
- 3.7.1.1 Growth in marine tourism
- 3.7.1.2 Increase in fishing activities
- 3.7.1.3 Technological advancements in trailer design
- 3.7.1.4 Growth in boat rental and sharing services
- 3.7.1.5 Rise in customization demand
- 3.7.2 Industry pitfalls & challenges
- 3.7.2.1 High initial and operating costs
- 3.7.2.2 Corrosion and maintenance issues
- 3.7.1 Growth drivers
- 3.8 Growth potential analysis
- 3.9 Porter's analysis
- 3.10 PESTEL analysis
Chapter 4 Competitive Landscape, 2024
- 4.1 Introduction
- 4.2 Company market share analysis
- 4.3 Competitive positioning matrix
- 4.4 Strategic outlook matrix
Chapter 5 Market Estimates & Forecast, By Product, 2021 - 2034 ($Bn, Thousand Units)
- 5.1 Key trends
- 5.2 Bulk handling equipment
- 5.3 Unit handling equipment
- 5.4 Parts & accessories
Chapter 6 Market Estimates & Forecast, By Equipment Type, 2021 - 2034 ($Bn, Thousand Units)
- 6.1 Key trends
- 6.2 Belt
- 6.3 Roller
- 6.4 Pallet
- 6.5 Overhead
- 6.6 Chain conveyors
- 6.7 Others
Chapter 7 Market Estimates & Forecast, By Application, 2021 - 2034 ($Bn, Thousand Units)
- 7.1 Key trends
- 7.2 Durable manufacturing
- 7.3 Food & beverage
- 7.4 General merchandise
- 7.5 Mining & construction
- 7.6 Transportation
- 7.7 Warehouse & distribution
- 7.8 Others (airports, etc.)
Chapter 8 Market Estimates & Forecast, By Distribution Channel, 2021 - 2034 ($Bn, Thousand Units)
- 8.1 Key trends
- 8.2 Direct
- 8.3 Indirect
Chapter 9 Market Estimates & Forecast, By Region, 2021 - 2034 ($Bn, Thousand Units)
- 9.1 Key trends
- 9.2 North America
- 9.2.1 U.S.
- 9.2.2 Canada
- 9.3 Europe
- 9.3.1 UK
- 9.3.2 Germany
- 9.3.3 France
- 9.3.4 Italy
- 9.3.5 Spain
- 9.3.6 Russia
- 9.4 Asia Pacific
- 9.4.1 China
- 9.4.2 India
- 9.4.3 Japan
- 9.4.4 South Korea
- 9.4.5 Australia
- 9.5 Latin America
- 9.5.1 Brazil
- 9.5.2 Mexico
- 9.6 MEA
- 9.6.1 UAE
- 9.6.2 Saudi Arabia
- 9.6.3 South Africa
Chapter 10 Company Profiles
- 10.1 BEUMER GROUP
- 10.2 Continental
- 10.3 Daifuku
- 10.4 Emerson Electric
- 10.5 Fives Group
- 10.6 FlexLink
- 10.7 Honeywell
- 10.8 Jungheinrich
- 10.9 Kardex
- 10.10 Kion Group
- 10.11 KUKA
- 10.12 Murata Machinery
- 10.13 Phoenix Conveyor Belt Systems
- 10.14 Siemens
- 10.15 TGW Logistics Group

