
PUBLISHER: Global Market Insights Inc. | PRODUCT CODE: 1750537

PUBLISHER: Global Market Insights Inc. | PRODUCT CODE: 1750537
Chilled Beams Market Opportunity, Growth Drivers, Industry Trend Analysis, and Forecast 2025 - 2034
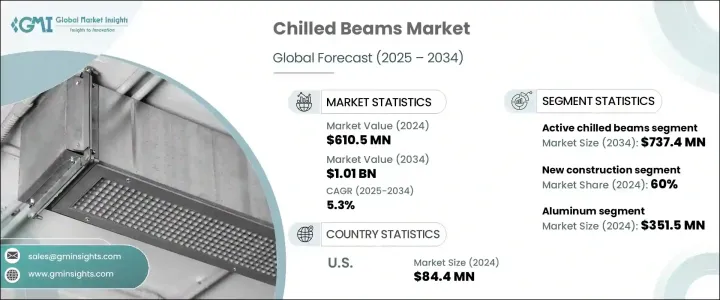
The Global Chilled Beams Market was valued at USD 610.5 million in 2024 and is estimated to grow at a CAGR of 5.3% to reach USD 1.01 billion by 2034, driven by a rising global focus on sustainable construction and energy-saving technologies. As energy regulations become more stringent and awareness around carbon reduction increases, chilled beam systems are gaining popularity for their high efficiency and eco-friendly performance. These systems are now recognized as essential in modern heating and cooling infrastructure. By utilizing water as a medium for heat exchange, chilled beams offer precise temperature control while significantly reducing energy consumption. Their ability to improve indoor air quality and reduce operational costs has further solidified their role in next-generation HVAC solutions.
The market pushes for sustainable buildings, reinforced by government mandates and green construction incentives. Demand is also being boosted by architectural trends that favor sleek, efficient, and customizable HVAC designs. With energy efficiency being a core aspect of new construction projects, chilled beams have become a preferred solution due to their reliability and environmental advantages. Additionally, these systems allow architects to integrate HVAC functionality into building aesthetics, creating seamless designs that contribute to both comfort and visual appeal.
| Market Scope | |
|---|---|
| Start Year | 2024 |
| Forecast Year | 2025-2034 |
| Start Value | $610.5 Million |
| Forecast Value | $1.01 Billion |
| CAGR | 5.3% |
Active chilled beams accounted for USD 438.5 million in market value in 2024 and are expected to reach USD 737.4 million by 2034. These systems are increasingly favored for their superior temperature regulation and the ability to support high-performance air quality. Unlike passive systems, active chilled beams incorporate air induction, providing greater airflow and precise control. They support green building certifications and reduce long-term energy costs, which makes them a preferred option in many commercial and institutional settings.
New building construction represented a 60% share in 2024. As urbanization expands and sustainable development becomes standard practice, chilled beams are being incorporated from the ground up in energy-efficient designs. Builders and developers prioritize green HVAC systems that meet environmental targets while delivering comfort and cost savings.
United States Chilled Beams Market with USD 84.4 million in 2024. The country's strong base of residential and commercial infrastructure projects supports robust demand. The focus on sustainability, combined with energy conservation policies and rapid growth in urban development, has fueled widespread adoption of chilled beam systems as an energy-efficient alternative to traditional HVAC setups.
To enhance their market position, companies such as Halton Group, Swegon AB, Barcol Air Group AG, Johnson Controls International Plc, Dadanco Europe, and Roccheggiani S.p.A are implementing a mix of product innovation and strategic expansion. Key strategies include offering modular and customizable solutions, integrating smart building features, and expanding global distribution networks. Many invest in R&D to develop systems that deliver energy performance and aesthetic flexibility, aligning with evolving architectural demands. Collaborations with developers and HVAC consultants further help them tailor offerings to specific regional needs.
Table of Contents
Chapter 1 Methodology & Scope
- 1.1 Market scope & definition
- 1.2 Base estimates & calculations
- 1.3 Forecast parameters
- 1.4 Data sources
- 1.4.1 Primary
- 1.4.2 Secondary
- 1.4.2.1 Paid sources
- 1.4.2.2 Public sources
Chapter 2 Executive Summary
- 2.1 Industry 3600 synopsis, 2021 - 2034
Chapter 3 Industry Insights
- 3.1 Industry ecosystem analysis
- 3.1.1 Factors affecting the value chain
- 3.1.2 Profit margin analysis
- 3.1.3 Disruptions
- 3.1.4 Future outlook
- 3.1.5 Manufacturers
- 3.1.6 Distributors
- 3.1.7 Retailors
- 3.2 Impact of Trump administration tariffs
- 3.2.1 Trade impact
- 3.2.1.1 Trade volume disruptions
- 3.2.1.2 Retaliatory measures
- 3.2.2 Impact on industry
- 3.2.2.1 Supply-side impact (raw materials)
- 3.2.2.1.1 Price volatility in key materials
- 3.2.2.1.2 Supply chain restructuring
- 3.2.2.1.3 Production cost implications
- 3.2.2.2 Demand-side impact (Cost to customers)
- 3.2.2.2.1 Price transmission to end markets
- 3.2.2.2.2 Market share dynamics
- 3.2.2.2.3 Consumer response patterns
- 3.2.2.1 Supply-side impact (raw materials)
- 3.2.3 Key companies impacted
- 3.2.4 Strategic industry responses
- 3.2.4.1 Supply chain reconfiguration
- 3.2.4.2 Pricing and product strategies
- 3.2.4.3 Policy engagement
- 3.2.5 Outlook & future considerations
- 3.2.1 Trade impact
- 3.3 Regulatory landscape
- 3.4 Impact forces
- 3.4.1 Growth drivers
- 3.4.1.1 Increasing demand for energy-efficient buildings
- 3.4.1.2 Rising building construction in Asia Pacific
- 3.4.1.3 Escalating growth of multi-service chilled beams in Europe
- 3.4.2 Industry pitfalls & challenges
- 3.4.2.1 High installation cost of chilled beams
- 3.4.1 Growth drivers
- 3.5 Growth potential analysis
- 3.6 Porter's analysis
- 3.7 PESTEL analysis
Chapter 4 Competitive Landscape, 2024
- 4.1 Introduction
- 4.2 Company market share analysis
- 4.3 Competitive positioning matrix
- 4.4 Strategic outlook matrix
Chapter 5 Market Estimates & Forecast, By Product Type, 2021 - 2034, (USD Million) (Thousand Units)
- 5.1 Key trends
- 5.2 Active chilled beams
- 5.3 Passive chilled beams
- 5.4 Multi-service chilled beams
Chapter 6 Market Estimates & Forecast, By Material, 2021 - 2034, (USD Million) (Thousand Units)
- 6.1 Key trends
- 6.2 Copper
- 6.3 Steel
- 6.4 Aluminum
- 6.5 Plastic
- 6.6 Composite materials
Chapter 7 Market Estimates & Forecast, By Application, 2021 - 2034, (USD Million) (Thousand Units)
- 7.1 Key trends
- 7.2 Residential
- 7.3 Commercial
- 7.4 Industrial
Chapter 8 Market Estimates & Forecast, By End Use, 2021 - 2034, (USD Million) (Thousand Units)
- 8.1 Key trends
- 8.2 New construction
- 8.3 Renovation
Chapter 9 Market Estimates & Forecast, By Region, 2021 - 2034, (USD Million) (Thousand Units)
- 9.1 Key trends
- 9.2 North America
- 9.2.1 U.S.
- 9.2.2 Canada
- 9.3 Europe
- 9.3.1 Germany
- 9.3.2 UK
- 9.3.3 France
- 9.3.4 Italy
- 9.3.5 Spain
- 9.3.6 Russia
- 9.4 Asia Pacific
- 9.4.1 China
- 9.4.2 India
- 9.4.3 Japan
- 9.4.4 South Korea
- 9.4.5 Australia
- 9.4.6 Malaysia
- 9.4.7 Indonesia
- 9.5 Latin America
- 9.5.1 Brazil
- 9.5.2 Mexico
- 9.6 MEA
- 9.6.1 UAE
- 9.6.2 Saudi Arabia
- 9.6.3 South Africa
Chapter 10 Company Profiles
- 10.1 Barcol Air Group AG
- 10.2 Caverion Corporation
- 10.3 Dadanco Europe
- 10.4 Emco Bau- und Klimatechnik GmbH & Co. KG
- 10.5 FlaktGroup
- 10.6 FTF Group
- 10.7 Halton Group
- 10.8 Johnson Controls International Plc
- 10.9 Lindab International AB
- 10.10 LTG Aktiengesellschaft
- 10.11 MADEL Air Technical Diffusion S.E.
- 10.12 Mestek, Inc.
- 10.13 Nijburg Industry Group.
- 10.14 NuClimate Air Quality Systems, Inc.
- 10.15 Price Industries Inc.
- 10.16 Roccheggiani S.p.A
- 10.17 SAS International
- 10.18 Swegon AB
- 10.19 TROX GmbH

