
PUBLISHER: Global Market Insights Inc. | PRODUCT CODE: 1858988

PUBLISHER: Global Market Insights Inc. | PRODUCT CODE: 1858988
Managed Network Services Market Opportunity, Growth Drivers, Industry Trend Analysis, and Forecast 2025 - 2034
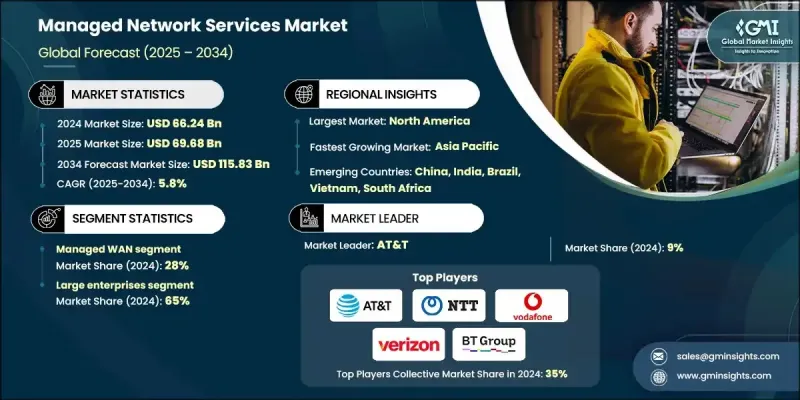
The Global Managed Network Services Market was valued at USD 66.24 billion in 2024 and is estimated to grow at a CAGR of 5.8% to reach USD 115.83 billion by 2034.
The market is becoming critical for enterprises aiming to simplify and secure their networking infrastructure. Rather than maintaining in-house teams for managing complex networks, companies are increasingly outsourcing to service providers that offer scalable, efficient, and secure solutions. The shift toward software-defined networking models, along with rapid digital transformation across industries, is playing a major role in this growth. Businesses today demand flexible and intelligent connectivity options across geographically dispersed locations, data centers, and cloud platforms. As cloud adoption and remote work continue to rise, organizations are opting for managed services that streamline operations and reduce operational burdens. With the inclusion of AI, automation, and integrated security within network architectures, managed service providers are helping enterprises enhance performance while optimizing costs.
| Market Scope | |
|---|---|
| Start Year | 2024 |
| Forecast Year | 2025-2034 |
| Start Value | $66.24 Billion |
| Forecast Value | $115.83 Billion |
| CAGR | 5.8% |
The managed WAN segment held a 28% share in 2024 and is projected to grow at a CAGR of 6.4% through 2034. WAN solutions play a crucial role in linking data centers, remote offices, and cloud resources. The demand for robust, scalable, and secure WAN networks continues to rise as companies expand globally and rely more heavily on cloud-based applications. Evolving technologies like SD-WAN are further driving adoption by improving traffic management and offering application-aware routing that enhances performance and reduces costs.
In 2024, the large enterprises segment held a 65% share and is expected to grow at a CAGR of 5.9% through 2034. These enterprises typically operate vast and intricate networks that connect global offices, employees, and infrastructure. Managing such complexity internally demands significant investment and expertise, which is why large corporations turn to managed service providers. Solutions like managed WAN and SD-WAN offer centralized visibility, scalability, and streamlined control, crucial features for enterprises with dynamic operational environments.
North America Managed Network Services Market held a 33% share in 2024, generating USD 21.91 billion. The region benefits from a well-established digital ecosystem, widespread enterprise technology adoption, and strong service provider presence. Companies like IBM, Cisco Systems, Verizon, and AT&T are continuously enhancing their offerings with automation, AI-driven analytics, and cloud-native tools, helping industries like finance, healthcare, logistics, and the public sector stay ahead with next-gen network infrastructure. This environment enables advanced network outsourcing models to thrive, further reinforcing North America's leadership.
Key players operating in the Global Managed Network Services Market include Cisco Systems, Lumen, Verizon, Vodafone, IBM, T-Systems, Orange, BT, AT&T, PCCW, and NTT. To secure a stronger foothold in the managed network services market, companies are focusing on integrated service offerings, AI-driven automation, and cloud-first architecture. Service providers are expanding portfolios to include SD-WAN, managed security, and hybrid cloud networking, aligning solutions with modern enterprise demands. Strategic partnerships with cloud providers and data center operators help extend network reach and improve service delivery. Firms are also investing in intelligent analytics platforms to deliver proactive network monitoring, predictive maintenance, and performance optimization.
Table of Contents
Chapter 1 Methodology
- 1.1 Research design
- 1.1.1 Research approach
- 1.1.2 Data collection methods
- 1.1.3 Base estimates and calculations
- 1.1.4 Base year calculation
- 1.1.5 Key trends for market estimates
- 1.1.6 GMI proprietary AI system
- 1.1.6.1 AI-Powered research enhancement
- 1.1.6.2 Source consistency protocol
- 1.1.6.3 AI accuracy metrics
- 1.2 Forecast model
- 1.3 Primary research and validation
- 1.3.1 Key trends for market estimates
- 1.3.2 Quantified market impact analysis
- 1.3.2.1 Mathematical impact of growth parameters on forecast
- 1.3.3 Scenario Analysis Framework
- 1.4 Some of the primary sources (but not limited to)
- 1.5 Data mining sources
- 1.5.1 Secondary
- 1.5.1.1 Paid Sources
- 1.5.1.2 Public Sources
- 1.5.1.3 Sources, by region
- 1.5.1 Secondary
- 1.6 Research Trail & Confidence Scoring
- 1.6.1 Research Trail Components:
- 1.6.2 Scoring Components
- 1.7 Research transparency addendum
- 1.7.1 Source attribution framework
- 1.7.2 Quality assurance metrics
- 1.7.3 Our commitment to trust
Chapter 2 Executive Summary
- 2.1 Industry 360° synopsis, 2021 - 2034
- 2.2 Key market trends
- 2.2.1 Regional
- 2.2.2 Service
- 2.2.3 Deployment mode
- 2.2.4 Organization Size
- 2.2.5 End Use Industry
- 2.3 TAM analysis, 2025-2034
- 2.4 CXO perspectives: Strategic imperatives
- 2.4.1 Executive decision points
- 2.4.2 Critical success factors
- 2.5 Future-outlook and strategic recommendations
Chapter 3 Industry Insights
- 3.1 Industry ecosystem analysis
- 3.1.1 Supplier landscape
- 3.1.2 Profit margin analysis
- 3.1.3 Cost structure
- 3.1.4 Value addition at each stage
- 3.1.5 Factor affecting the value chain
- 3.1.6 Disruptions
- 3.2 Industry impact forces
- 3.2.1 Growth drivers
- 3.2.1.1 Growing demand for reliable and secure networks
- 3.2.1.2 Rising adoption of cloud services
- 3.2.1.3 Expansion of IoT and connected devices
- 3.2.1.4 Cost-efficiency and budget optimization
- 3.2.1.5 Increasing cyber threats and regulatory compliance
- 3.2.1.6 Remote work and hybrid workforce trends
- 3.2.2 Industry pitfalls and challenges
- 3.2.2.1 High dependency on third-party providers
- 3.2.2.2 Data privacy and security concerns
- 3.2.3 Market opportunities
- 3.2.3.1 5G network expansion
- 3.2.3.2 Growing demand in SMEs
- 3.2.3.3 AI and automation integration
- 3.2.3.4 Rise of edge computing
- 3.2.1 Growth drivers
- 3.3 Growth potential analysis
- 3.4 Business case analysis
- 3.4.1 ROI calculation models & payback period analysis
- 3.4.2 Risk assessment & mitigation strategies
- 3.4.3 Performance metrics
- 3.4.4 Change management & organizational readiness
- 3.5 Future market outlook
- 3.5.1 Technology convergence roadmap
- 3.5.2 Next-generation service models
- 3.5.3 Industry 4.0 integration & digital twin networking
- 3.5.4 Sustainability initiatives & carbon neutral networking
- 3.5.5 Investment opportunities & market entry strategies
- 3.5.6 Risk assessment & scenario planning
- 3.5.7 Emerging market opportunities & untapped segments
- 3.6 Vendor selection guide & implementation framework
- 3.6.1 Comprehensive vendor evaluation methodology
- 3.6.2 Contract negotiation strategies
- 3.6.3 Change management & staff training requirements
- 3.6.4 Performance monitoring & continuous improvement
- 3.6.5 Exit strategy planning & vendor transition management
- 3.7 Patent analysis
- 3.8 Regulatory landscape
- 3.9 Technology and innovation landscape
- 3.9.1 Current technological trends
- 3.9.2 Emerging technologies
- 3.10 Price trends
- 3.10.1 By region
- 3.10.2 By product
- 3.11 Cost breakdown analysis
- 3.12 Total cost of ownership (TCO) analysis
- 3.13 Porter's analysis
- 3.14 PESTEL analysis
- 3.15 Investment & funding trends analysis
- 3.16 Service level agreement (SLA) benchmarking & penalty analysis
- 3.17 AI & automation integration impact assessment
- 3.18 Sustainability and environmental aspects
- 3.18.1 Sustainable practices
- 3.18.2 Waste reduction strategies
- 3.18.3 Energy efficiency in production
- 3.18.4 Eco-friendly initiatives
- 3.19 Carbon footprint considerations
Chapter 4 Competitive Landscape, 2024
- 4.1 Introduction
- 4.2 Company market share analysis
- 4.2.1 North America
- 4.2.2 Europe
- 4.2.3 Asia Pacific
- 4.2.4 Latin America
- 4.2.5 Middle East & Africa
- 4.3 Competitive analysis of major market players
- 4.4 Competitive positioning matrix
- 4.5 Strategic outlook matrix
- 4.6 Technology innovation & R&D investment analysis
- 4.7 Go-to-market strategies
- 4.8 Customer satisfaction benchmarking
- 4.9 Key developments
- 4.9.1 Mergers & acquisitions
- 4.9.2 Partnerships & collaborations
- 4.9.3 New product launches
- 4.9.4 Expansion plans and funding
Chapter 5 Market Estimates & Forecast, By Service, 2021 - 2034 ($Bn)
- 5.1 Key trends
- 5.2 Managed LAN
- 5.3 Managed VPN
- 5.4 Managed WAN
- 5.5 Managed Wi-Fi
- 5.6 Managed security
- 5.7 Managed monitoring
- 5.8 Others
Chapter 6 Market Estimates & Forecast, By Deployment Mode, 2021 - 2034 ($Bn)
- 6.1 Key trends
- 6.2 On?premises
- 6.3 Cloud
Chapter 7 Market Estimates & Forecast, By Organization Size, 2021 - 2034 ($Bn)
- 7.1 Key trends
- 7.2 Small & medium?sized enterprises (SMEs)
- 7.3 Large enterprises
Chapter 8 Market Estimates & Forecast, By End Use Industry, 2021 - 2034 ($Bn)
- 8.1 Key trends
- 8.2 BFSI
- 8.3 IT & Telecommunications
- 8.4 Retail & e?commerce
- 8.5 Healthcare
- 8.6 Manufacturing
- 8.7 Government & utilities
- 8.8 Media & entertainment
- 8.9 Education
- 8.10 Others
Chapter 9 Market Estimates & Forecast, By Region, 2021 - 2034 ($Bn)
- 9.1 Key trends
- 9.2 North America
- 9.2.1 US
- 9.2.2 Canada
- 9.3 Europe
- 9.3.1 Germany
- 9.3.2 UK
- 9.3.3 France
- 9.3.4 Italy
- 9.3.5 Spain
- 9.3.6 Nordics
- 9.3.7 Russia
- 9.4 Asia Pacific
- 9.4.1 China
- 9.4.2 India
- 9.4.3 Japan
- 9.4.4 Australia
- 9.4.5 Indonesia
- 9.4.6 Philippines
- 9.4.7 Thailand
- 9.4.8 South Korea
- 9.4.9 Singapore
- 9.5 Latin America
- 9.5.1 Brazil
- 9.5.2 Mexico
- 9.5.3 Argentina
- 9.6 Middle East and Africa
- 9.6.1 Saudi Rabia
- 9.6.2 South Africa
- 9.6.3 UAE
Chapter 10 Company Profiles
- 10.1 Global Players
- 10.1.1 Cisco Systems
- 10.1.2 International Business Machines (IBM)
- 10.1.3 Accenture
- 10.1.4 Microsoft
- 10.1.5 Amazon Web Services (AWS)
- 10.1.6 Verizon Communications
- 10.1.7 AT&T
- 10.1.8 Hewlett Packard Enterprise (HPE)
- 10.1.9 NTT
- 10.1.10 Dell Technologies
- 10.2 Regional Players
- 10.2.1 BT
- 10.2.2 Orange Business Services
- 10.2.3 Deutsche Telekom
- 10.2.4 Tata Communications
- 10.2.5 TELUS
- 10.2.6 Telefonica Tech
- 10.2.7 SoftBank
- 10.2.8 China Telecom
- 10.2.9 Singtel
- 10.2.10 Etisalat
- 10.3 Emerging Players / Disruptors
- 10.3.1 Aryaka Networks
- 10.3.2 Cato Networks
- 10.3.3 Zscaler
- 10.3.4 Windstream Enterprise
- 10.3.5 GTT Communications

