
PUBLISHER: Global Market Insights Inc. | PRODUCT CODE: 1666935

PUBLISHER: Global Market Insights Inc. | PRODUCT CODE: 1666935
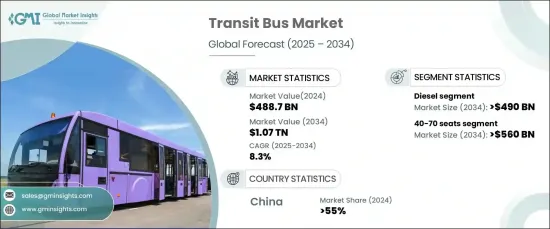
Transit Bus Market Opportunity, Growth Drivers, Industry Trend Analysis, and Forecast 2025 - 2034
The Global Transit Bus Market is experiencing significant growth, projected to reach a value of USD 488.7 billion by 2024, with an expected CAGR of 8.3% from 2025 to 2034. This growth is driven by urbanization and the increasing density of populations in cities worldwide. As urban areas expand, the demand for efficient, sustainable public transportation solutions is intensifying. Transit agencies are working to modernize bus networks to meet the needs of growing populations, improve mobility, and reduce congestion. The rising demand for accessible, cost-effective transport options is further motivating governments to invest in advanced technologies like real-time tracking systems and smarter routing solutions, positioning buses as key to achieving both economic growth and environmental goals.
The need for sustainable transportation is also pushing the transit sector towards zero-emission solutions. Governments worldwide are mandating the adoption of electric and hydrogen-powered buses to meet ambitious carbon reduction targets. With strict regulations and policies aimed at reducing emissions, governments are offering financial incentives to support the shift toward greener technologies. This transition to cleaner vehicles is a direct response to climate change concerns and the need for better urban air quality. As a result, businesses in the transit sector are seizing new opportunities to integrate electric and hydrogen-powered buses into their fleets.
| Market Scope | |
|---|---|
| Start Year | 2024 |
| Forecast Year | 2025-2034 |
| Start Value | $488.7 Billion |
| Forecast Value | $1.07 Trillion |
| CAGR | 8.3% |
The market is segmented by fuel type, with diesel, CNG, electric, and others being the key categories. Diesel buses currently dominate the market, holding over 51% of the market share in 2024. However, advancements in emission control technologies, such as selective catalytic reduction (SCR) and diesel particulate filters (DPF), are enabling diesel buses to meet increasingly stringent environmental standards. Hybrid diesel-electric powertrains are also gaining popularity, providing a transitional option between traditional diesel buses and fully electric models. These systems combine the fuel efficiency of diesel engines with the benefits of electric motors, such as regenerative braking and optimized energy management, making them a viable solution for reducing emissions while transitioning to full electrification.
Seating capacity plays a significant role in shaping the market, with buses typically falling into three categories: below 40 seats, 40-70 seats, and above 70 seats. The 40-70 seat segment is anticipated to exceed USD 560 billion by 2034, driven by advances in electric powertrains and battery technologies. Manufacturers are increasingly focused on optimizing battery performance to improve range, charging speed, and cost-efficiency. Innovations in lithium-ion and solid-state batteries are expected to extend operational cycles and lower production costs, facilitating wider adoption of electric buses.
In terms of regional markets, China continues to lead the global transit bus market, contributing over 55% of revenue in 2024. Stringent government policies aimed at reducing emissions and improving air quality have accelerated the shift to electric buses. Generous government subsidies and incentives have played a significant role in supporting the adoption of electric buses, particularly in major cities where these buses are becoming a crucial part of public transport systems. Leading manufacturers in China are playing a vital role in this transformation, contributing to the country's goal of achieving a fully electric public transport fleet.
Table of Contents
Chapter 1 Methodology & Scope
- 1.1 Research design
- 1.1.1 Research approach
- 1.1.2 Data collection methods
- 1.2 Base estimates and calculations
- 1.2.1 Base year calculation
- 1.2.2 Key trends for market estimates
- 1.3 Forecast model
- 1.4 Primary research & validation
- 1.4.1 Primary sources
- 1.4.2 Data mining sources
- 1.5 Market definitions
Chapter 2 Executive Summary
- 2.1 Industry 3600 synopsis, 2021 - 2034
Chapter 3 Industry Insights
- 3.1 Industry ecosystem analysis
- 3.2 Supplier landscape
- 3.2.1 Component manufacturers
- 3.2.2 Automotive OEM
- 3.2.3 Tier-1 suppliers
- 3.2.4 Charging infrastructure providers
- 3.2.5 End use
- 3.3 Profit margin analysis
- 3.4 Technology differentiators
- 3.4.1 Electric powertrain technology
- 3.4.2 Semi-autonomous capabilities
- 3.4.3 IoT integration
- 3.4.4 Hydrogen fuel cell technology
- 3.4.5 Others
- 3.5 Key news & initiatives
- 3.6 Patent analysis
- 3.7 Regulatory landscape
- 3.8 Impact forces
- 3.8.1 Growth drivers
- 3.8.1.1 Growing urbanization and increasing population density in urban areas
- 3.8.1.2 Growing adoption of environmental regulations
- 3.8.1.3 Growing electrification of transit buses
- 3.8.1.4 Growing infrastructure investments in public transportation
- 3.8.2 Industry pitfalls & challenges
- 3.8.2.1 High initial investment costs
- 3.8.2.2 Charging infrastructure regulations
- 3.8.1 Growth drivers
- 3.9 Growth potential analysis
- 3.10 Porter’s analysis
- 3.11 PESTEL analysis
Chapter 4 Competitive Landscape, 2024
- 4.1 Introduction
- 4.2 Company market share analysis
- 4.3 Competitive positioning matrix
- 4.4 Strategic outlook matrix
Chapter 5 Market Estimates & Forecast, By Fuel, 2021 - 2034 ($Bn, Units)
- 5.1 Key trends
- 5.2 Diesel
- 5.3 Compressed natural gas (CNG)
- 5.4 Electric
- 5.4.1 Battery electric vehicle
- 5.4.2 Fuel cell electric vehicle
- 5.4.3 Hybrid electric vehicle
Chapter 6 Market Estimates & Forecast, By Seating Capacity, 2021 - 2034 ($Bn, Units)
- 6.1 Key trends
- 6.2 Below 40 seats
- 6.2.1 Urban transit
- 6.2.2 Suburban transit
- 6.2.3 Intercity
- 6.2.4 Others
- 6.3 40-70 seats
- 6.3.1 Urban transit
- 6.3.2 Suburban transit
- 6.3.3 Intercity
- 6.3.4 Others
- 6.4 Above 70 seats
- 6.4.1 Urban transit
- 6.4.2 Suburban transit
- 6.4.3 Intercity
- 6.4.4 Others
Chapter 7 Market Estimates & Forecast, By Application, 2021 - 2034 ($Bn, Units)
- 7.1 Key trends
- 7.2 Urban transit
- 7.3 Suburban transit
- 7.4 Intercity
- 7.5 Others
Chapter 8 Market Estimates & Forecast, By Region, 2021 - 2034 ($Bn, Units)
- 8.1 Key trends
- 8.2 North America
- 8.2.1 U.S.
- 8.2.2 Canada
- 8.3 Europe
- 8.3.1 UK
- 8.3.2 Germany
- 8.3.3 France
- 8.3.4 Spain
- 8.3.5 Italy
- 8.3.6 Russia
- 8.3.7 Nordics
- 8.4 Asia Pacific
- 8.4.1 China
- 8.4.2 India
- 8.4.3 Japan
- 8.4.4 South Korea
- 8.4.5 ANZ
- 8.4.6 Southeast Asia
- 8.5 Latin America
- 8.5.1 Brazil
- 8.5.2 Mexico
- 8.5.3 Argentina
- 8.6 MEA
- 8.6.1 UAE
- 8.6.2 South Africa
- 8.6.3 Saudi Arabia
Chapter 9 Company Profiles
- 9.1 Anhui Ankai Automobile
- 9.2 Ashok Leyland
- 9.3 Beiqi Foton Motor
- 9.4 BYD
- 9.5 Daimler
- 9.6 Ebusco
- 9.7 Irizar Group
- 9.8 IVECO
- 9.9 King Long United Automotive Industry
- 9.10 MAN
- 9.11 NFI Group
- 9.12 Proterra
- 9.13 Scania
- 9.14 Solaris Bus & Couch
- 9.15 TATA Motors
- 9.16 VDL Bus & Coach
- 9.17 Volvo
- 9.18 Xiamen Golden Dragon Bus
- 9.19 Yutong
- 9.20 Zhengzhou Yutong Bus
- 9.21 Zhongtong Bus

