
PUBLISHER: Global Market Insights Inc. | PRODUCT CODE: 1844316

PUBLISHER: Global Market Insights Inc. | PRODUCT CODE: 1844316
Smart Agriculture Market Opportunity, Growth Drivers, Industry Trend Analysis, and Forecast 2025 - 2034
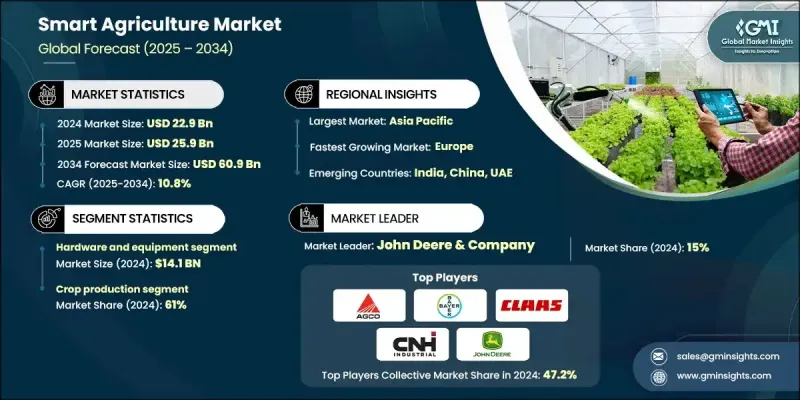
The Global Smart Agriculture Market was valued at USD 22.9 billion in 2024 and is estimated to grow at a CAGR of 10.8% to reach USD 60.9 billion by 2034.
Rising food demand driven by rapid population growth, labor shortages in the agriculture workforce, and escalating climate challenges is fueling the shift toward technology-driven farming. Governments and industry leaders are responding with targeted strategies to improve agricultural efficiency, boost resilience, and promote long-term sustainability. With global food requirements projected to rise by 60% by 2050, there is a growing urgency to enhance productivity using innovative digital tools and automation. Smart agriculture is becoming central to addressing climate-related disruptions like erratic rainfall, rising temperatures, and increased natural disasters that threaten yields and food safety. As a result, digitalization in farming operations is rapidly gaining momentum, supported by funding initiatives and strategic partnerships across public and private sectors. A key enabler of this transformation is precision farming, which leverages real-time data and automation to optimize inputs and outputs, reduce resource waste, and enhance food security across geographies.
| Market Scope | |
|---|---|
| Start Year | 2024 |
| Forecast Year | 2025-2034 |
| Start Value | $22.9 Billion |
| Forecast Value | $60.9 Billion |
| CAGR | 10.8% |
The hardware and equipment segment generated USD 14.1 billion in 2024 and is forecast to register a CAGR of 10.9% through 2034. This segment continues to gain traction as modern farms adopt connected equipment powered by sensors, robotics, and AI. Advanced machinery and autonomous systems are making it easier for agricultural producers to improve yields and monitor field conditions with greater accuracy and less manual effort.
The crop production segment accounted for a 61% share in 2024 and is expected to grow at a CAGR of 10.6% between 2025 and 2034. The integration of digital tools, such as remote sensing, precision irrigation, and real-time soil monitoring, is transforming how crops are cultivated, managed, and harvested. Smart solutions are enhancing productivity by optimizing inputs, reducing waste, and ensuring healthier yields through advanced monitoring and data analytics.
United States Smart Agriculture Market held a 76% share in 2024 and generated USD 4.6 billion. Growth in the region is fueled by aggressive federal support aimed at improving sustainable farming practices. In 2024 alone, billions in funding were allocated to help farmers implement eco-friendly strategies over millions of acres of land. These efforts are encouraging the adoption of technologies that support conservation, soil health, and climate adaptation.
Key players active in the Global Smart Agriculture Market include Bayer, CNH Industrial, Mahindra & Mahindra, Kubota, Trimble, Taranis, CLAAS Group, Monarch Tractor, Prospera Technologies, Topcon, John Deere & Company, AGCO, Yara International, Farmers Edge, and Carbon Robotics. Leading smart agriculture companies are investing heavily in automation, AI, and IoT to deliver integrated farming solutions that enhance precision and reduce operational costs. Strategic acquisitions and collaborations with agritech startups allow them to expand technological capabilities and offer data-driven platforms for real-time decision-making. These companies are also building partnerships with regional governments and cooperatives to boost adoption in emerging markets. Many are focusing on scalable, modular equipment to appeal to both large commercial farms and smaller agricultural producers.
Table of Contents
Chapter 1 Methodology & Scope
- 1.1 Market scope and definition
- 1.2 Research design
- 1.2.1 Research approach
- 1.2.2 Data collection methods
- 1.3 Data mining sources
- 1.3.1 Global
- 1.3.2 Regional/Country
- 1.4 Base estimates and calculations
- 1.4.1 Base year calculation
- 1.4.2 Key trends for market estimation
- 1.5 Primary research and validation
- 1.5.1 Primary sources
- 1.6 Forecast model
- 1.7 Research assumptions and limitations
Chapter 2 Executive Summary
- 2.1 Industry 3600 synopsis
- 2.2 Key market trends
- 2.2.1 Regional
- 2.2.2 Product type
- 2.2.3 Application
- 2.3 CXO perspectives: Strategic imperatives
- 2.3.1 Key decision points for industry executives
- 2.3.2 Critical success factors for market players
- 2.4 Future Outlook and Strategic Recommendations
Chapter 3 Industry Insights
- 3.1 Industry ecosystem analysis
- 3.1.1 Supplier Landscape
- 3.1.2 Profit Margin
- 3.1.3 Value addition at each stage
- 3.1.4 Factor affecting the value chain
- 3.2 Industry impact forces
- 3.2.1 Growth drivers
- 3.2.1.1 Rising global food demand & population growth
- 3.2.1.2 Labor shortage & automation need
- 3.2.1.3 Climate change adaptation requirements
- 3.2.2 Industry pitfalls & challenges
- 3.2.2.1 High initial investment & implementation costs
- 3.2.2.2 Limited rural connectivity infrastructure
- 3.2.2.3 Return on Investment Uncertainty
- 3.2.3 Opportunities
- 3.2.3.1 Carbon credit & environmental service markets
- 3.2.3.2 AI & machine learning integration
- 3.2.3.3 Autonomous farming systems development
- 3.2.1 Growth drivers
- 3.3 Growth potential analysis
- 3.4 Future market trends
- 3.5 Technology and Innovation landscape
- 3.5.1 Current technological trends
- 3.5.2 Emerging technologies
- 3.6 Price trends
- 3.6.1 By region
- 3.6.2 By product type
- 3.7 Regulatory landscape
- 3.7.1 Standards and compliance requirements
- 3.7.2 Regional regulatory frameworks
- 3.7.3 Certification standards
- 3.8 Trade Statistics
- 3.8.1 Major importing countries
- 3.8.2 Major exporting countries
- 3.9 Porter’s analysis
- 3.10 PESTEL analysis
Chapter 4 Competitive Landscape, 2024
- 4.1 Introduction
- 4.2 Company market share analysis
- 4.2.1 By region
- 4.2.1.1 North America
- 4.2.1.2 Europe
- 4.2.1.3 Asia Pacific
- 4.2.1.4 Latin America
- 4.2.1.5 MEA
- 4.2.1 By region
- 4.3 Company matrix analysis
- 4.4 Competitive analysis of major market players
- 4.5 Competitive positioning matrix
- 4.6 Key developments
- 4.6.1 Mergers & acquisitions
- 4.6.2 Partnerships & collaborations
- 4.6.3 New Product Launches
- 4.6.4 Expansion Plans
Chapter 5 Market Estimates & Forecast, By Product Type, 2021 - 2034 ($Billion)
- 5.1 Key trends
- 5.2 Hardware & equipment
- 5.2.1 GNSS guidance & steering systems
- 5.2.2 IoT sensors & monitoring devices
- 5.2.3 Autonomous & robotic systems
- 5.2.4 Precision application equipment
- 5.3 Software & digital platforms
- 5.3.1 Farm management information systems (FMIS)
- 5.3.2 Decision support systems
- 5.3.3 Supply chain & traceability platforms
- 5.4 Services & connectivity
- 5.4.1 Connectivity solutions
- 5.4.2 Cloud computing & data analytics
- 5.4.3 Professional services
Chapter 6 Market Estimates & Forecast, By Application, 2021 - 2034 ($Billion)
- 6.1 Key trends
- 6.2 Crop production
- 6.2.1 Precision planting & seeding
- 6.2.2 Nutrient management
- 6.2.3 Crop protection
- 6.2.4 Irrigation management
- 6.3 Livestock management
- 6.3.1 Animal health monitoring
- 6.3.2 Automated feeding systems
- 6.3.3 Breeding & reproduction management
- 6.4 Post-harvest & supply chain
- 6.4.1 Yield monitoring & analysis
- 6.4.2 Storage & handling optimization
- 6.4.3 Traceability & compliance
Chapter 7 Market Estimates & Forecast, By Region, 2021 - 2034 ($Billion)
- 7.1 Key trends
- 7.2 North America
- 7.2.1 U.S.
- 7.2.2 Canada
- 7.3 Europe
- 7.3.1 Germany
- 7.3.2 UK
- 7.3.3 France
- 7.3.4 Spain
- 7.3.5 Italy
- 7.3.6 Netherlands
- 7.4 Asia Pacific
- 7.4.1 China
- 7.4.2 Japan
- 7.4.3 India
- 7.4.4 Australia
- 7.4.5 South Korea
- 7.5 Latin America
- 7.5.1 Brazil
- 7.5.2 Mexico
- 7.5.3 Argentina
- 7.6 Middle East and Africa
- 7.6.1 South Africa
- 7.6.2 Saudi Arabia
- 7.6.3 UAE
Chapter 8 Company Profiles
- 8.1 AGCO
- 8.2 Bayer
- 8.3 Carbon Robotics
- 8.4 CLAAS Group
- 8.5 CNH Industrial
- 8.6 Farmers Edge
- 8.7 John Deere & Company
- 8.8 Kubota
- 8.9 Mahindra & Mahindra
- 8.10 Monarch Tractor
- 8.11 Prospera Technologies
- 8.12 Taranis
- 8.13 Topcon
- 8.14 Trimble
- 8.15 Yara International

