
PUBLISHER: Global Market Insights Inc. | PRODUCT CODE: 1667013

PUBLISHER: Global Market Insights Inc. | PRODUCT CODE: 1667013
Barrier Material Market Opportunity, Growth Drivers, Industry Trend Analysis, and Forecast 2025 - 2034
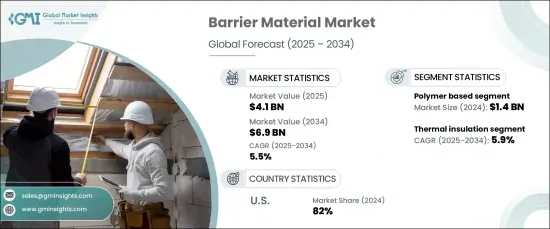
The Global Barrier Material Market was valued at USD 4.1 billion in 2024 and is poised to grow at a CAGR of 5.5% between 2025 and 2034. This upward trajectory is fueled by surging demand for advanced solutions that enhance safety and security across diverse industries such as construction, automotive, pharmaceuticals, and food packaging. As these sectors prioritize protecting their products and structures from external threats, the reliance on barrier materials continues to rise.
Barrier materials, essential for preventing moisture intrusion, thermal fluctuations, and sound penetration, are critical to improving the durability and efficiency of various applications. With increasing regulatory scrutiny on sustainability, businesses are transitioning toward eco-friendly, recyclable, and high-performance materials to meet modern industry standards. Moreover, technological advancements and R&D efforts are driving innovation, offering cutting-edge solutions tailored to meet specific industry needs, ultimately expanding the market's potential.
| Market Scope | |
|---|---|
| Start Year | 2024 |
| Forecast Year | 2025-2034 |
| Start Value | $4.1 Billion |
| Forecast Value | $6.9 Billion |
| CAGR | 5.5% |
By material type, the market is segmented into metal-based, mineral-based, polymer-based, and other categories. The polymer-based segment, valued at USD 1.4 billion in 2024, is expected to grow at a CAGR of 5.6% through 2035. Renowned for their superior ability to prevent water infiltration, polymer-based materials are the go-to choice for roofing, basement, and foundation systems, addressing the growing concerns about water damage. These materials have become indispensable for both new construction and renovation projects, offering reliable protection against environmental factors. Meanwhile, metal-based materials are vital in environments exposed to extreme weather conditions, such as coastal regions or industrial zones prone to high pollution, making them an essential component for structural resilience.
When categorized by function, the market includes moisture prevention, thermal insulation, soundproofing, fire protection, and other segments. Thermal insulation commanded a significant 41% market share in 2024 and is projected to grow at a 5.9% CAGR during the forecast period. Rising energy costs and stringent energy efficiency regulations have heightened the demand for advanced thermal barriers. These materials are instrumental in reducing heat loss and optimizing energy consumption, particularly in heating and cooling systems, aligning with the global focus on sustainability and cost-effective energy solutions.
In the United States, the barrier material market accounted for 82% of the regional share in 2024. This dominance is driven by robust regulatory frameworks aimed at reducing plastic waste and encouraging sustainable practices. Businesses are increasingly adopting biodegradable, low-carbon-footprint materials, including recyclable multi-layer films, biopolymer-based plastics, and compostable packaging, to cater to eco-conscious consumers. This shift reflects a commitment to environmental stewardship and positions the industry for continued growth in alignment with sustainability goals.
Table of Contents
Chapter 1 Methodology & Scope
- 1.1 Market scope & definitions
- 1.2 Base estimates & calculations
- 1.3 Forecast calculations
- 1.4 Data sources
- 1.4.1 Primary
- 1.4.2 Secondary
- 1.4.2.1 Paid sources
- 1.4.2.2 Public sources
Chapter 2 Executive Summary
- 2.1 Industry synopsis, 2021-2035
Chapter 3 Industry Insights
- 3.1 Industry ecosystem analysis
- 3.1.1 Factor affecting the value chain
- 3.1.2 Profit margin analysis
- 3.1.3 Disruptions
- 3.1.4 Future outlook
- 3.1.5 Manufacturers
- 3.1.6 Distributors
- 3.2 Supplier landscape
- 3.3 Profit margin analysis
- 3.4 Key news & initiatives
- 3.5 Regulatory landscape
- 3.6 Impact forces
- 3.6.1 Growth drivers
- 3.6.1.1 Increasing construction activities
- 3.6.1.2 Growing product innovation
- 3.6.2 Industry pitfalls & challenges
- 3.6.2.1 Market saturation and intense competition
- 3.6.2.2 Sustainability concerns
- 3.6.1 Growth drivers
- 3.7 Growth potential analysis
- 3.8 Porter’s analysis
- 3.9 PESTEL analysis
Chapter 4 Competitive Landscape, 2023
- 4.1 Introduction
- 4.2 Company market share analysis
- 4.3 Competitive positioning matrix
- 4.4 Strategic outlook matrix
Chapter 5 Market Estimates & Forecast, By Material, 2021-2035 (USD Million) (Kilo Tons)
- 5.1 Key trends
- 5.2 Polymer based
- 5.2.1 Polyvinylidene chloride (PVDC)
- 5.2.2 Ethylene vinyl alcohol (EVOH)
- 5.2.3 Polyethylene naphthalate (PEN)
- 5.3 Others
- 5.4 Metal based
- 5.5 Mineral based
- 5.5.1 Geosynthetic clay liners (GCLs)
- 5.5.2 Gypsum
- 5.6 Others (mineral wood, etc.)
- 5.7 Others (fibrous material based, etc.)
Chapter 6 Market Estimates & Forecast, By Function, 2021-2035 (USD Million) (Kilo Tons)
- 6.1 Key trends
- 6.2 Moisture prevention
- 6.3 Thermal insulation
- 6.4 Sound proofing
- 6.5 Fire protection
- 6.6 Others (radiation barrier, sealant, etc.)
Chapter 7 Market Estimates & Forecast, By Type of Barrier, 2021-2035 (USD Million) (Kilo Tons)
- 7.1 Key trends
- 7.2 Temporary barriers
- 7.3 Permanent barriers
Chapter 8 Market Estimates & Forecast, By Type of Construction, 2021-2035 (USD Million) (Kilo Tons)
- 8.1 Key trends
- 8.2 New construction
- 8.3 Retrofit
Chapter 9 Market Estimates & Forecast, By End Use, 2021-2035 (USD Million) (Kilo Tons)
- 9.1 Key trends
- 9.2 Residential
- 9.3 Commercial
- 9.4 Industrial and warehousing
- 9.5 Infrastructure facility
Chapter 10 Market Estimates & Forecast, By Distribution Channel, 2021-2035 (USD Million) (Kilo Tons)
- 10.1 Key trends
- 10.2 Direct
- 10.3 Indirect
Chapter 11 Market Estimates & Forecast, By Region, 2021-2035 (USD Million) (Kilo Tons)
- 11.1 Key trends
- 11.2 North America
- 11.2.1 U.S.
- 11.2.2 Canada
- 11.3 Europe
- 11.3.1 UK
- 11.3.2 Germany
- 11.3.3 France
- 11.3.4 Italy
- 11.3.5 Spain
- 11.3.6 Russia
- 11.4 Asia Pacific
- 11.4.1 China
- 11.4.2 India
- 11.4.3 Japan
- 11.4.4 South Korea
- 11.4.5 Australia
- 11.5 Latin America
- 11.5.1 Brazil
- 11.5.2 Mexico
- 11.6 MEA
- 11.6.1 UAE
- 11.6.2 Saudi Arabia
- 11.6.3 South Africa
Chapter 12 Company Profiles
- 12.1 3M
- 12.2 BASF
- 12.3 Dow
- 12.4 Geosynthetics
- 12.5 Gundle/SLT Environmental
- 12.6 H.B. Fuller
- 12.7 Honeywell International
- 12.8 Owosso
- 12.9 Pall Corporation
- 12.10 Renolit
- 12.11 Saint-Gobain
- 12.12 Sika
- 12.13 Solvay
- 12.14 TenCate Geosynthetics
- 12.15 Trelleborg

