
PUBLISHER: Global Market Insights Inc. | PRODUCT CODE: 1755331

PUBLISHER: Global Market Insights Inc. | PRODUCT CODE: 1755331
Banking as a Service Market Opportunity, Growth Drivers, Industry Trend Analysis, and Forecast 2025 - 2034
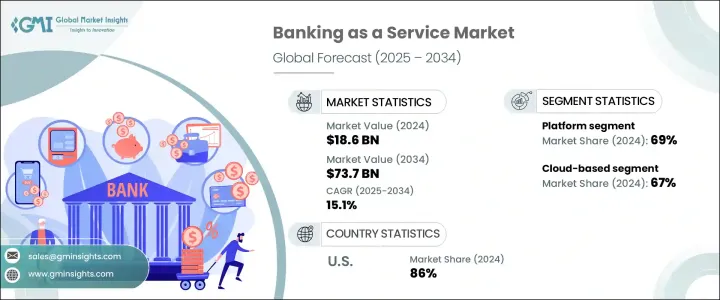
The Global Banking as a Service Market was valued at USD 18.6 billion in 2024 and is estimated to grow at a CAGR of 15.1% to reach USD 73.7 billion by 2034, attributed to the increasing need for embedded financial services, the growing adoption of fintech solutions, and the ongoing digital transformation of traditional banking systems. BaaS allows third-party platforms to integrate banking services, such as payments, lending, and account management, directly into their offerings via APIs. This integration streamlines operations and greatly enhances the customer experience.
As consumers increasingly demand seamless, on-demand financial services, BaaS is emerging as the ideal solution to meet this need. It allows non-bank platforms to offer a wide range of banking features while minimizing the complexities of setting up traditional banking infrastructure. The digital transformation of banks, driven by the adoption of cloud computing, artificial intelligence, and advanced data analytics, is a major catalyst for this market growth. Banks are modernizing their systems to facilitate the efficient integration of BaaS offerings, empowering fintech companies and other third-party providers to deliver tailored financial services while ensuring improved customer experiences.
| Market Scope | |
|---|---|
| Start Year | 2024 |
| Forecast Year | 2025-2034 |
| Start Value | $18.6 Billion |
| Forecast Value | $73.7 Billion |
| CAGR | 15.1% |
The platform segment held a 69% share in 2024 and will continue to grow at a CAGR of 15% through 2034. BaaS platforms offer a robust infrastructure for the integration of financial services into non-bank applications, providing scalable, flexible solutions for fintechs, neobanks, and other third-party providers. These platforms deliver APIs that simplify access to core banking functions like payments, account creation, and compliance.
Cloud-based Banking as a Service platforms segment held 67% share in 2024. This dominance is projected to continue, with the segment expected to grow at a robust CAGR of 15.5% through 2034. The cloud model offers benefits that make it highly attractive to financial technology firms and traditional banks. Its scalability and flexibility allow companies to rapidly scale operations and expand their service offerings, often without significant upfront investments in physical infrastructure.
United States Banking as a Service Market held 86% share in 2024 driven by the increasing demand for embedded financial services, and supportive regulatory frameworks are key drivers behind this expansion. U.S. banks leverage BaaS platforms to improve digital offerings, enhance customer engagement, and streamline product development. Partnerships between traditional financial institutions and fintech companies have fostered a dynamic financial ecosystem, allowing banks to monetize their services while enabling fintech to develop cutting-edge solutions.
Leading players in the Global Banking as a Service sector include ClearBank Ltd., Fiserv, Galileo Financial Technologies, Mambu, Marqeta, Railsr, Solaris SE, Green Dot, Plaid, and Finastra. To secure a stronger foothold in the Banking-as-a-Service market, companies develop innovative, flexible, and scalable platforms that cater to large and small financial institutions. Key players are also forming strategic partnerships with fintech firms, traditional banks, and tech companies to expand their offerings and reach new markets. Additionally, companies are investing heavily in enhancing the security, efficiency, and regulatory compliance of their platforms, enabling them to meet the diverse needs of customers while ensuring smooth and seamless integration.
Table of Contents
Chapter 1 Methodology & Scope
- 1.1 Research design
- 1.1.1 Research approach
- 1.1.2 Data collection methods
- 1.2 Base estimates and calculations
- 1.2.1 Base year calculation
- 1.2.2 Key trends for market estimates
- 1.3 Forecast model
- 1.4 Primary research & validation
- 1.4.1 Primary sources
- 1.4.2 Data mining sources
- 1.5 Market definitions
Chapter 2 Executive Summary
- 2.1 Industry 3600 synopsis, 2021 - 2034
Chapter 3 Industry Insights
- 3.1 Industry ecosystem analysis
- 3.2 Supplier landscape
- 3.2.1 Licensed banks
- 3.2.2 BaaS platform providers
- 3.2.3 Enablers/aggregators
- 3.2.4 Distributors
- 3.2.5 End use
- 3.3 Profit margin analysis
- 3.4 Technology & innovation landscape
- 3.5 Use case analysis
- 3.5.1 FinTech adoption case studies
- 3.5.2 BaaS in e-commerce and super apps
- 3.5.3 Digital banks leveraging BaaS
- 3.6 Consumer behavior & adoption trend
- 3.7 Future outlook trends
- 3.8 Patent analysis
- 3.9 Key news & initiatives
- 3.10 Regulatory landscape
- 3.11 Impact forces
- 3.11.1 Growth drivers
- 3.11.1.1 Rising demand for digital banking services
- 3.11.1.2 Growing popularity of embedded finance
- 3.11.1.3 Increasing advancements in advanced technologies
- 3.11.1.4 Popularity of open banking
- 3.11.1.5 Rising adoption of cloud computing
- 3.11.2 Industry pitfalls & challenges
- 3.11.2.1 Data security and privacy concerns
- 3.11.2.2 High development and maintenance costs
- 3.11.1 Growth drivers
- 3.12 Growth potential analysis
- 3.13 Porter's analysis
- 3.14 PESTEL analysis
Chapter 4 Competitive Landscape, 2024
- 4.1 Introduction
- 4.2 Company market share analysis
- 4.3 Competitive positioning matrix
- 4.4 Strategic outlook matrix
Chapter 5 Market Estimates & Forecast, By Component, 2021 - 2034 ($Bn)
- 5.1 Key trends
- 5.2 Platform
- 5.3 Services
Chapter 6 Market Estimates & Forecast, By Type, 2021 - 2034 ($Bn)
- 6.1 Key trends
- 6.2 API-based
- 6.3 Cloud-based
Chapter 7 Market Estimates & Forecast, By Enterprise Size, 2021 - 2034 ($Bn)
- 7.1 Key trends
- 7.2 Large enterprises
- 7.3 Small & medium enterprises
Chapter 8 Market Estimates & Forecast, By Application, 2021 - 2034 ($Bn)
- 8.1 Key trends
- 8.2 Digital banking
- 8.3 Payment processing
- 8.4 Lending
- 8.5 Banking compliance
- 8.6 Account & transaction management
- 8.7 Card issuance
Chapter 9 Market Estimates & Forecast, By End Use, 2021 - 2034 ($Bn)
- 9.1 Key trends
- 9.2 Banks
- 9.3 NBFC
- 9.4 Others
Chapter 10 Market Estimates & Forecast, By Region, 2021 - 2034 ($Bn)
- 10.1 Key trends
- 10.2 North America
- 10.2.1 U.S.
- 10.2.2 Canada
- 10.3 Europe
- 10.3.1 UK
- 10.3.2 Germany
- 10.3.3 France
- 10.3.4 Italy
- 10.3.5 Spain
- 10.3.6 Russia
- 10.3.7 Nordics
- 10.4 Asia Pacific
- 10.4.1 China
- 10.4.2 India
- 10.4.3 Japan
- 10.4.4 South Korea
- 10.4.5 ANZ
- 10.4.6 Southeast Asia
- 10.5 Latin America
- 10.5.1 Brazil
- 10.5.2 Mexico
- 10.5.3 Argentina
- 10.6 MEA
- 10.6.1 UAE
- 10.6.2 Saudi Arabia
- 10.6.3 South Africa
Chapter 11 Company Profiles
- 11.1 Banco Bilbao Vizcaya Argentaria
- 11.2 Bnkbl Ltd
- 11.3 ClearBank Ltd
- 11.4 Cross River Bank
- 11.5 Finastra
- 11.6 Fiserv
- 11.7 Galileo Financial Technologies
- 11.8 Green Dot
- 11.9 Mambu
- 11.10 Marqeta
- 11.11 MatchMove Pay Pte Ltd
- 11.12 OpenPayd
- 11.13 Plaid
- 11.14 Project Imagine
- 11.15 Railsr
- 11.16 Sila
- 11.17 Solaris SE
- 11.18 Square, Inc
- 11.19 Starling Bank
- 11.20 Treasury Prime

