
PUBLISHER: Global Market Insights Inc. | PRODUCT CODE: 1666714

PUBLISHER: Global Market Insights Inc. | PRODUCT CODE: 1666714
Air Separation Unit Market Opportunity, Growth Drivers, Industry Trend Analysis, and Forecast 2025 - 2034
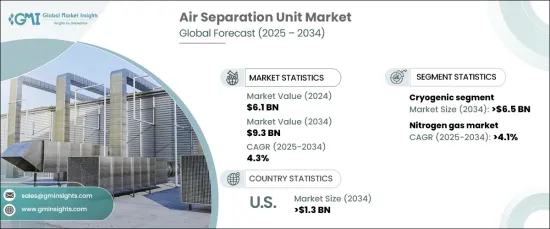
The Global Air Separation Unit Market, valued at USD 6.1 billion in 2024, is projected to grow at a steady CAGR of 4.3% from 2025 to 2034. This growth is fueled by the rising demand for industrial gases, technological advancements, and a strong emphasis on sustainable practices across various sectors. Expanding industries and the shift toward cleaner energy solutions have further amplified the need for gases such as oxygen and nitrogen, bolstering the demand for ASUs.
Innovations in technology, including enhanced cryogenic processes and the integration of automation, are driving the development of more efficient and cost-effective air separation solutions. The focus on energy-efficient and compact designs has paved the way for modular ASUs that align with industry goals to minimize energy usage and operational expenses. These advancements cater to industries aiming to streamline processes while prioritizing environmental responsibility.
| Market Scope | |
|---|---|
| Start Year | 2024 |
| Forecast Year | 2025-2034 |
| Start Value | $6.1 Billion |
| Forecast Value | $9.3 Billion |
| CAGR | 4.3% |
The cryogenic air separation unit segment is poised to surpass USD 6.5 billion by 2034, supported by the growing industrial need for high-purity gases. These units are increasingly utilized in diverse applications, offering tailored solutions to meet specific gas requirements. The ability of cryogenic ASUs to deliver superior gas purity makes them indispensable for numerous industrial processes.
Nitrogen, a critical component for many applications, is anticipated to experience a CAGR of over 4.1% through 2034. Rising usage in sectors like manufacturing, food processing, and electronics is a key driver of this trend. ASUs are evolving to accommodate varying purity levels of nitrogen, providing flexibility for industries with unique specifications. This adaptability is reshaping how industries approach gas production and supply.
In the United States, the ASU market is expected to exceed USD 1.3 billion by 2034. The increasing focus on reducing carbon emissions and adhering to stringent environmental regulations is significantly influencing the industry's trajectory. ASUs play a vital role in supporting this transition by enabling cleaner production processes and ensuring a consistent supply of industrial gases. Moreover, the demand for reliable gas systems in healthcare settings, particularly for high-purity oxygen, is contributing to market growth.
Table of Contents
Chapter 1 Methodology & Scope
- 1.1 Market scope & definitions
- 1.2 Market estimates & forecast parameters
- 1.3 Forecast calculation
- 1.4 Data sources
- 1.4.1 Primary
- 1.4.2 Secondary
- 1.4.2.1 Paid
- 1.4.2.2 Public
Chapter 2 Executive Summary
- 2.1 Industry synopsis, 2021 - 2034
Chapter 3 Industry Insights
- 3.1 Industry ecosystem analysis
- 3.2 Regulatory landscape
- 3.3 Industry impact forces
- 3.3.1 Growth drivers
- 3.3.2 Industry pitfalls & challenges
- 3.4 Growth potential analysis
- 3.5 Porter's analysis
- 3.5.1 Bargaining power of suppliers
- 3.5.2 Bargaining power of buyers
- 3.5.3 Threat of new entrants
- 3.5.4 Threat of substitutes
- 3.6 PESTEL analysis
Chapter 4 Competitive Landscape, 2024
- 4.1 Introduction
- 4.2 Strategic outlook
- 4.3 Innovation & sustainability landscape
Chapter 5 Market Size and Forecast, By Process, 2021 – 2034 (USD Billion)
- 5.1 Key trends
- 5.2 Cryogenic
- 5.3 Non-Cryogenic
Chapter 6 Market Size and Forecast, By Gas, 2021 – 2034 (USD Billion)
- 6.1 Key trends
- 6.2 Nitrogen
- 6.3 Oxygen
- 6.4 Argon
- 6.5 Others
Chapter 7 Market Size and Forecast, By End Use, 2021 – 2034 (USD Billion)
- 7.1 Key trends
- 7.2 Iron & steel
- 7.3 Oil & gas
- 7.4 Healthcare
- 7.5 Chemicals
- 7.6 Others
Chapter 8 Market Size and Forecast, By Region, 2021 – 2034 (USD Billion)
- 8.1 Key trends
- 8.2 North America
- 8.2.1 U.S.
- 8.2.2 Canada
- 8.3 Europe
- 8.3.1 Germany
- 8.3.2 France
- 8.3.3 UK
- 8.3.4 Spain
- 8.3.5 Italy
- 8.4 Asia Pacific
- 8.4.1 China
- 8.4.2 India
- 8.4.3 Japan
- 8.4.4 Australia
- 8.4.5 South Korea
- 8.5 Middle East & Africa
- 8.5.1 Saudi Arabia
- 8.5.2 UAE
- 8.5.3 South Africa
- 8.6 Latin America
- 8.6.1 Brazil
- 8.6.2 Argentina
Chapter 9 Company Profiles
- 9.1 Air Liquide
- 9.2 Air Products and Chemicals
- 9.3 Cryotec Anlagenbau
- 9.4 Kaifeng Air Separation Group
- 9.5 Linde
- 9.6 Messer
- 9.7 Praxair Technology
- 9.8 Ranch Cryogenics
- 9.9 Sichuan Air Separation Plant Group
- 9.10 Taiyo Nippon Sanso
- 9.11 Universal Industrial Gases
- 9.12 Yingde Gases

