
PUBLISHER: Global Market Insights Inc. | PRODUCT CODE: 1666893

PUBLISHER: Global Market Insights Inc. | PRODUCT CODE: 1666893
Pepper Market Opportunity, Growth Drivers, Industry Trend Analysis, and Forecast 2025 - 2034
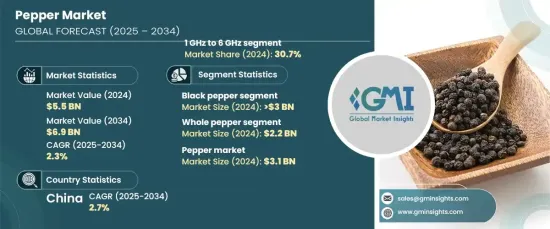
The Global Pepper Market, valued at USD 5.5 billion in 2024, is projected to grow at a CAGR of 2.3% from 2025 to 2034. This market includes the cultivation, trade, and consumption of various pepper types, such as black, white, and green varieties. Growth is driven by increasing demand across industries like food and beverage, pharmaceuticals, and cosmetics.
Market expansion is further fueled by a shift toward natural seasonings and heightened awareness of pepper's health benefits, including its antioxidant and anti-inflammatory properties. Developing regions present significant growth potential through improved supply chain management and the introduction of organic and specialty pepper products.
| Market Scope | |
|---|---|
| Start Year | 2024 |
| Forecast Year | 2025-2034 |
| Start Value | $5.5 Billion |
| Forecast Value | $6.9 Billion |
| CAGR | 2.3% |
Black pepper holds a dominant market share, contributing over USD 3 billion in 2024, and is expected to grow at a CAGR of more than 2.7% during the forecast period. Its widespread application in culinary, medicinal, and preservation processes underpins this growth. Additionally, rising demand for premium and organic black pepper is expanding the market as consumers increasingly seek high-quality, natural products.
Whole pepper is another significant segment, with a market value of USD 2.2 billion in 2024 and a projected CAGR of 2.6% through 2034. This segment appeals to consumers and industries alike for its ability to preserve flavor and essential oils, which enhance taste and freshness. Whole pepper finds broad applications in spice blends, seasonings, and food preservation, contributing to its steady market growth.
The food and beverage industry is a key driver of pepper market growth, with the segment reaching a valuation of USD 3.1 billion in 2024 and expected to grow at a 2.7% CAGR through 2034. Pepper is a fundamental ingredient in numerous culinary applications, including processed foods, snacks, sauces, and seasonings. Rising consumer interest in organic and preservative-free ingredients further boosts demand in this sector.
The pepper market in China is one of the largest globally, reaching USD 667.6 million in 2024, and anticipated to grow at a CAGR of 2.7% through 2034. The increasing use of pepper in food processing, in line with growing health and wellness trends, drives demand. Additionally, the market benefits from advancements in e-commerce and opportunities in exports, contributing to its long-term growth potential.
Table of Contents
Chapter 1 Methodology & Scope
- 1.1 Market scope & definitions
- 1.2 Base estimates & calculations
- 1.3 Forecast calculations
- 1.4 Data sources
- 1.4.1 Primary
- 1.4.2 Secondary
- 1.4.2.1 Paid sources
- 1.4.2.2 Public sources
Chapter 2 Executive Summary
- 2.1 Industry synopsis, 2021-2034
Chapter 3 Industry Insights
- 3.1 Industry ecosystem analysis
- 3.1.1 Factor affecting the value chain
- 3.1.2 Profit margin analysis
- 3.1.3 Disruptions
- 3.1.4 Future outlook
- 3.1.5 Manufacturers
- 3.1.6 Distributors
- 3.2 Supplier landscape
- 3.3 Profit margin analysis
- 3.4 Key news & initiatives
- 3.5 Regulatory landscape
- 3.6 Impact forces
- 3.6.1 Growth drivers
- 3.6.1.1 Increasing demand for pepper in emerging markets
- 3.6.1.2 Growing popularity of spicy cuisines around the world
- 3.6.1.3 Increasing consumer preference for organic and high-quality pepper varieties
- 3.6.1.4 Health benefits
- 3.6.2 Industry pitfalls & challenges
- 3.6.2.1 Competition from other spices and condiments
- 3.6.2.2 Food safety concerns
- 3.6.1 Growth drivers
- 3.7 Growth potential analysis
- 3.8 Porter’s analysis
- 3.9 PESTEL analysis
Chapter 4 Competitive Landscape, 2024
- 4.1 Introduction
- 4.2 Company market share analysis
- 4.3 Competitive positioning matrix
- 4.4 Strategic outlook matrix
Chapter 5 Market Estimates & Forecast, By Product Type, 2021-2034 (USD Billion) (Kilo Tons)
- 5.1 Key trends
- 5.2 Black pepper
- 5.3 White pepper
- 5.4 Green pepper
- 5.5 Others
Chapter 6 Market Estimates & Forecast, By Form, 2021-2034 (USD Billion) (Kilo Tons)
- 6.1 Key trends
- 6.2 Whole pepper
- 6.3 Ground pepper
- 6.4 Pepper flakes
- 6.5 Pepper paste
- 6.6 Others
Chapter 7 Market Estimates & Forecast, By Application, 2021-2034 (USD Billion) (Kilo Tons)
- 7.1 Key trends
- 7.2 Food and beverages
- 7.3 Pharmaceuticals
- 7.4 Personal care products
- 7.5 Others
Chapter 8 Market Estimates & Forecast, By Region, 2021-2034 (USD Billion) (Kilo Tons)
- 8.1 Key trends
- 8.2 North America
- 8.2.1 U.S.
- 8.2.2 Canada
- 8.3 Europe
- 8.3.1 UK
- 8.3.2 Germany
- 8.3.3 France
- 8.3.4 Italy
- 8.3.5 Spain
- 8.3.6 Russia
- 8.4 Asia Pacific
- 8.4.1 China
- 8.4.2 India
- 8.4.3 Japan
- 8.4.4 South Korea
- 8.4.5 Australia
- 8.5 Latin America
- 8.5.1 Brazil
- 8.5.2 Mexico
- 8.6 MEA
- 8.6.1 South Africa
- 8.6.2 Saudi Arabia
- 8.6.3 UAE
Chapter 9 Company Profiles
- 9.1 Bart Ingredients
- 9.2 British Pepper & Spice Co Ltd
- 9.3 Catch Foods
- 9.4 Everest Spices
- 9.5 Frontier Co-op
- 9.6 McCormick & Company, Inc.
- 9.7 MDH Spices
- 9.8 Olam International
- 9.9 Synthite Industries Ltd
- 9.10 The Spice Hunter, Inc.

