
PUBLISHER: Global Market Insights Inc. | PRODUCT CODE: 1684829

PUBLISHER: Global Market Insights Inc. | PRODUCT CODE: 1684829
Glass Mat Market Opportunity, Growth Drivers, Industry Trend Analysis, and Forecast 2025 - 2034
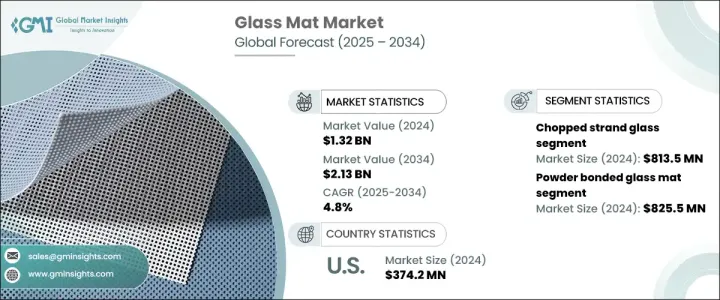
The Global Glass Mat Market reached a value of USD 1.32 billion in 2024 and is expected to experience steady growth at a CAGR of 4.8% from 2025 to 2034. This growth is largely driven by rising demand in critical industries such as construction, automotive, marine, and electrical, all of which are increasingly relying on the superior properties of glass mats to improve product performance and efficiency. Glass mats, made from fine glass fibers, are highly valued for their strength, durability, and lightweight characteristics, making them an ideal material for composite applications.
As industries shift toward more sustainable and high-performance materials, glass mats have emerged as a key player due to their corrosion resistance, excellent thermal insulation, and energy-efficient properties. In construction, for example, these mats are utilized in roofing, flooring, and wall panels, meeting the evolving demands of modern building standards. Additionally, the automotive sector's focus on reducing vehicle weight and enhancing fuel efficiency is fueling demand for glass mats. The growing emphasis on environmental sustainability is also driving the demand for glass mats, particularly as manufacturers seek materials that contribute to energy-efficient construction and transportation solutions.
| Market Scope | |
|---|---|
| Start Year | 2024 |
| Forecast Year | 2025-2034 |
| Start Value | $1.32 Billion |
| Forecast Value | $2.13 Billion |
| CAGR | 4.8% |
In terms of product types, chopped strand glass mats hold a dominant position in the market, generating USD 813.5 million in 2024 and accounting for a 61.4% share. This product type's versatility and cost-effectiveness make it particularly appealing for use in the automotive and construction sectors. Meanwhile, continuous filament glass mats, known for their superior strength and durability, are gaining momentum, particularly in industries such as aerospace and wind energy, where high-performance composites are in demand. Although this segment represents a smaller portion of the market, it is steadily growing as the demand for advanced composite materials continues to rise.
When it comes to binder types, the market is divided primarily into powder-bonded and emulsion-bonded glass mats. In 2024, the powder-bonded segment generated USD 825.5 million, securing a 63.6% market share. This binder type is cost-effective and adaptable, making it widely used across various industries. However, emulsion-bonded glass mats, which offer superior resin impregnation and enhanced mechanical properties, are gaining popularity in sectors requiring advanced material performance. This shift signals the market's move toward a broader range of products to cater to evolving industry demands.
In North America, the U.S. glass mat market generated USD 374.2 million in 2024, supported by the strong presence of the construction and automotive industries. North America's commitment to environmental sustainability, along with the adoption of cutting-edge manufacturing technologies, further bolsters its dominance in the market. The region's focus on innovation, coupled with stringent environmental regulations, plays a significant role in driving demand for glass mats and solidifying the U.S.'s position as a market leader.
Table of Contents
Chapter 1 Methodology & Scope
- 1.1 Market scope & definition
- 1.2 Base estimates & calculations
- 1.3 Forecast calculation
- 1.4 Data sources
- 1.4.1 Primary
- 1.4.2 Secondary
- 1.4.2.1 Paid sources
- 1.4.2.2 Public sources
Chapter 2 Executive Summary
- 2.1 Industry synopsis, 2021-2034
Chapter 3 Industry Insights
- 3.1 Industry ecosystem analysis
- 3.1.1 Factor affecting the value chain
- 3.1.2 Profit margin analysis
- 3.1.3 Disruptions
- 3.1.4 Future outlook
- 3.1.5 Manufacturers
- 3.1.6 Distributors
- 3.2 Supplier landscape
- 3.3 Profit margin analysis
- 3.4 Key news & initiatives
- 3.5 Regulatory landscape
- 3.6 Impact forces
- 3.6.1 Growth drivers
- 3.6.1.1 Increasing demand for lightweight and sustainable materials
- 3.6.1.2 Rising consumer goods and packaging demands
- 3.6.2 Industry pitfalls & challenges
- 3.6.2.1 Environmental concerns and regulatory pressures
- 3.6.1 Growth drivers
- 3.7 Growth potential analysis
- 3.8 Porter’s analysis
- 3.9 PESTEL analysis
Chapter 4 Competitive Landscape, 2024
- 4.1 Introduction
- 4.2 Company market share analysis
- 4.3 Competitive positioning matrix
- 4.4 Strategic outlook matrix
Chapter 5 Market Size and Forecast, By Mat Type, 2021-2034 (USD Million) (Kilo Tons)
- 5.1 Key trends
- 5.2 chopped strand glass mat
- 5.3 continuous filament glass mat
Chapter 6 Market Size and Forecast, By Binder Type, 2021-2034 (USD Million) (Kilo Tons)
- 6.1 Key trends
- 6.2 Powder bonded glass mat
- 6.3 Emulsion bonded glass mat
Chapter 7 Market Size and Forecast, By Application, 2021-2034 (USD Million) (Kilo Tons)
- 7.1 Key trends
- 7.2 Construction & infrastructure
- 7.3 Industrial applications
- 7.4 Automotive
- 7.5 Marine
- 7.6 Sports & leisure goods
- 7.7 Others
Chapter 8 Market Size and Forecast, By Region, 2021-2034 (USD Million) (Kilo Tons)
- 8.1 Key trends
- 8.2 North America
- 8.2.1 U.S.
- 8.2.2 Canada
- 8.3 Europe
- 8.3.1 UK
- 8.3.2 Germany
- 8.3.3 France
- 8.3.4 Italy
- 8.3.5 Spain
- 8.3.6 Russia
- 8.4 Asia Pacific
- 8.4.1 China
- 8.4.2 India
- 8.4.3 Japan
- 8.4.4 South Korea
- 8.4.5 Australia
- 8.5 Latin America
- 8.5.1 Brazil
- 8.5.2 Mexico
- 8.6 MEA
- 8.6.1 South Africa
- 8.6.2 Saudi Arabia
- 8.6.3 UAE
Chapter 9 Company Profiles
- 9.1 Ashland
- 9.2 Fibretech Industries
- 9.3 Nitto Boseki
- 9.4 P-D Glasseiden
- 9.5 PPG Industries
- 9.6 Taishan Fiberglass

