
PUBLISHER: Global Market Insights Inc. | PRODUCT CODE: 1684844

PUBLISHER: Global Market Insights Inc. | PRODUCT CODE: 1684844
Vitamin B12 ingredient Market Opportunity, Growth Drivers, Industry Trend Analysis, and Forecast 2025 - 2034
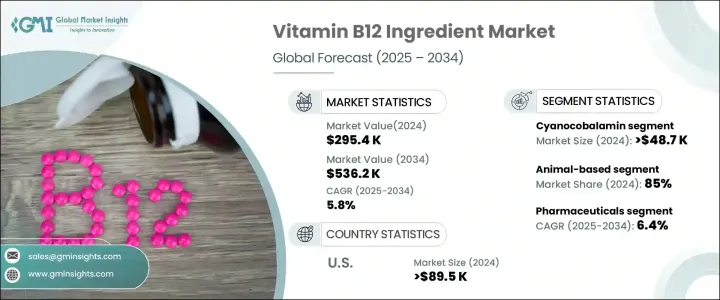
The Global Vitamin B12 Ingredient Market was valued at USD 295.4 thousand in 2024 and is projected to grow at a robust CAGR of 5.8% from 2025 to 2034. As consumers become increasingly health-conscious, there is a rising awareness of the critical role vitamins and minerals play in maintaining overall well-being, which has significantly boosted the demand for essential nutrients like Vitamin B12. Additionally, the global shift towards plant-based and vegan diets, which often lack natural sources of Vitamin B12, has intensified the demand for fortified foods and dietary supplements. This growing shift in dietary habits, combined with increasing health awareness, is positioning Vitamin B12 as a key ingredient in food and supplements across the world.
The growing preference for plant-based diets, coupled with a rise in the number of vegans and vegetarians, has created an opportunity for Vitamin B12 to play a larger role in supplementing nutrient deficiencies. Many people, especially in urbanized regions, are incorporating fortified foods into their daily nutrition regimen. The market is also witnessing a significant increase in demand for Vitamin B12 supplements, as consumers are looking for convenient ways to ensure they meet their nutritional needs. These factors, combined with greater access to Vitamin B12-enriched products, are expected to continue driving the market's expansion over the next decade.
| Market Scope | |
|---|---|
| Start Year | 2024 |
| Forecast Year | 2025-2034 |
| Start Value | $295.4 Thousand |
| Forecast Value | $536.2 Thousand |
| CAGR | 5.8% |
In 2024, the cyanocobalamin segment generated USD 48.7 thousand, solidifying its position as one of the most crucial forms of Vitamin B12 in the market. Cyanocobalamin is favored by manufacturers due to its affordability, long shelf life, and ease of large-scale production. These factors contribute to its widespread adoption across the food and supplement industries. Moreover, its stable nature during storage and transportation, along with its cost-effectiveness, has solidified its status as the most popular form of Vitamin B12 for fortification purposes.
The market remains heavily reliant on animal-based sources, which accounted for 85% of the total Vitamin B12 ingredient market share in 2024. This segment benefits from the traditional use of meat, dairy, and eggs as primary sources of Vitamin B12. These animal-based products play an integral role in fortifying staple foods such as milk, yogurt, and meat, which are commonly consumed across diverse populations. Despite the increasing popularity of plant-based diets, animal-derived Vitamin B12 remains a dominant player due to its long-standing presence in conventional dietary habits and its essential role in food fortification.
In the U.S., the Vitamin B12 ingredient market generated USD 89.5 thousand in 2024, driven by a surge in consumer demand for health and wellness products. The growing popularity of dietary supplements and fortified foods is further accelerating market growth in North America. Consumers, increasingly aware of the benefits of proper nutrition, continue to prioritize foods and supplements rich in Vitamin B12, making the U.S. one of the most lucrative markets globally. With a high percentage of health-conscious individuals, the region is expected to see sustained demand for Vitamin B12-rich products in the coming years.
Table of Contents
Chapter 1 Methodology & Scope
- 1.1 Market scope & definition
- 1.2 Base estimates & calculations
- 1.3 Forecast calculation
- 1.4 Data sources
- 1.4.1 Primary
- 1.4.2 Secondary
- 1.4.2.1 Paid sources
- 1.4.2.2 Public sources
Chapter 2 Executive Summary
- 2.1 Industry synopsis, 2021-2034
Chapter 3 Industry Insights
- 3.1 Industry ecosystem analysis
- 3.1.1 Factor affecting the value chain
- 3.1.2 Profit margin analysis
- 3.1.3 Disruptions
- 3.1.4 Future outlook
- 3.1.5 Manufacturers
- 3.1.6 Distributors
- 3.2 Supplier landscape
- 3.3 Profit margin analysis
- 3.4 Key news & initiatives
- 3.5 Regulatory landscape
- 3.6 Impact forces
- 3.6.1 Growth drivers
- 3.6.1.1 Increasing demand for fortified foods
- 3.6.1.2 Prevalence of Vitamin B12 deficiency
- 3.6.1.3 Rising health & wellness consciousness
- 3.6.1.4 Expanding pharmaceutical industry
- 3.6.2 Industry pitfalls & challenges
- 3.6.2.1 Vitamin B12 ingredient
- 3.6.2.2 Quality control and purity
- 3.6.2.3 Regulatory compliance
- 3.6.1 Growth drivers
- 3.7 Growth potential analysis
- 3.8 Porter’s analysis
- 3.9 PESTEL analysis
Chapter 4 Competitive Landscape, 2024
- 4.1 Introduction
- 4.2 Company market share analysis
- 4.3 Competitive positioning matrix
- 4.4 Strategic outlook matrix
Chapter 5 Market Size and Forecast, By Form, 2021-2034 (USD Thousand) (Kilo Tons)
- 5.1 Key trends
- 5.2 Cyanocobalamin
- 5.3 Methylcobalamin
- 5.4 Hydroxocobalamin
- 5.5 Adenosylcobalamin
Chapter 6 Market Size and Forecast, By Source, 2021-2034 (USD Thousand) (Kilo Tons)
- 6.1 Key trends
- 6.2 Animal-Based
- 6.3 Plant-Based
Chapter 7 Market Size and Forecast, By Application, 2021-2034 (USD Thousand) (Kilo Tons)
- 7.1 Key trends
- 7.2 Pharmaceuticals
- 7.3 Dietary supplements
- 7.4 Medications
- 7.5 Food and beverages
- 7.6 Fortified foods
- 7.7 Energy drinks and shots
- 7.8 Infant formula
- 7.9 Cosmetics and personal care
- 7.10 Skin care products
- 7.11 Hair care products
- 7.12 Oral care products
- 7.13 Animal feed and nutrition
Chapter 8 Market Size and Forecast, By End-Use Industries, 2021-2034 (USD Thousand) (Kilo Tons)
- 8.1 Key trends
- 8.2 Human nutrition
- 8.3 Animal nutrition
Chapter 9 Market Size and Forecast, By Region, 2021-2034 (USD Thousand) (Kilo Tons)
- 9.1 Key trends
- 9.2 North America
- 9.2.1 U.S.
- 9.2.2 Canada
- 9.3 Europe
- 9.3.1 UK
- 9.3.2 Germany
- 9.3.3 France
- 9.3.4 Italy
- 9.3.5 Spain
- 9.3.6 Russia
- 9.4 Asia Pacific
- 9.4.1 China
- 9.4.2 India
- 9.4.3 Japan
- 9.4.4 South Korea
- 9.4.5 Australia
- 9.5 Latin America
- 9.5.1 Brazil
- 9.5.2 Mexico
- 9.6 MEA
- 9.6.1 South Africa
- 9.6.2 Saudi Arabia
- 9.6.3 UAE
Chapter 10 Company Profiles
- 10.1 Adisseo
- 10.2 BASF SE
- 10.3 DSM Nutritional Products
- 10.4 Gnosis by Lesaffre
- 10.5 Jubilant Life Sciences
- 10.6 Lonza
- 10.7 Merck KGaA
- 10.8 NOW Foods
- 10.9 NutraGenesis
- 10.10 Nutrilo
- 10.11 Pharmavit
- 10.12 Rousselot
- 10.13 Spectrum Chemical Manufacturing
- 10.14 Thermo Fisher Scientific
- 10.15 Zhejiang Shengda Bio-Pharm

