
PUBLISHER: Global Market Insights Inc. | PRODUCT CODE: 1876816

PUBLISHER: Global Market Insights Inc. | PRODUCT CODE: 1876816
Clean Label Ingredients Market Opportunity, Growth Drivers, Industry Trend Analysis, and Forecast 2025 - 2034
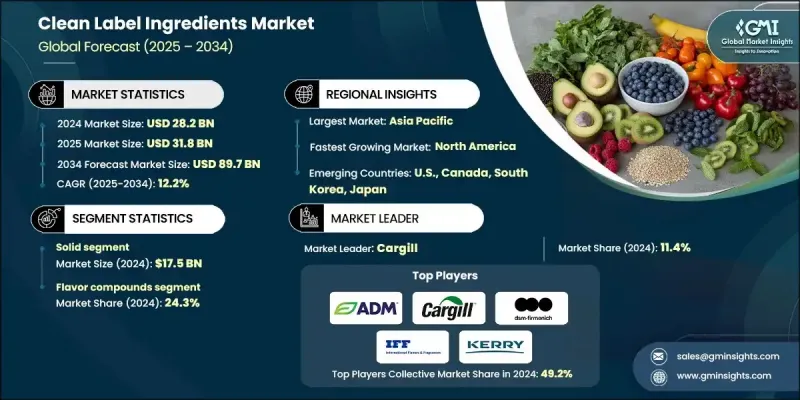
The Global Clean Label Ingredients Market was valued at USD 28.2 billion in 2024 and is estimated to grow at a CAGR of 12.2% to reach USD 89.7 billion by 2034.
The market's rapid growth is attributed to the strong consumer demand for transparency, natural sourcing, and minimally processed food products. Clean label ingredients refer to natural and simple ingredients that are free from artificial additives, colors, preservatives, and synthetic chemicals. The preference for clean and traceable food sources has become a significant purchasing factor, especially among health-conscious consumers who prioritize safety and wellness. Global trends toward healthier eating habits, coupled with stricter government regulations regarding food additives and labeling, are encouraging the transition from synthetic ingredients to naturally derived alternatives. Manufacturers are increasingly reformulating products with organic, plant-based, and non-GMO ingredients to align with evolving consumer expectations and sustainability goals. In addition, technological advances in natural extraction and fermentation are enabling cleaner, more stable ingredient profiles without compromising flavor, functionality, or shelf life. These combined trends, health awareness, regulatory evolution, and innovation in natural processing are reshaping the global clean label ingredient landscape.
| Market Scope | |
|---|---|
| Start Year | 2024 |
| Forecast Year | 2025-2034 |
| Start Value | $28.2 Billion |
| Forecast Value | $89.7 Billion |
| CAGR | 12.2% |
The solid form segment generated USD 17.5 billion in 2024. Solid ingredients such as powdered proteins, granulated preservatives, crystalline sweeteners, and dehydrated flavor compounds dominate due to their stability, easy handling, and adaptability across food manufacturing processes. These forms provide manufacturers with extended shelf life, precise dosing control, and seamless integration into large-scale food production systems. Demand remains high across key applications, including bakery, confectionery, and processed food categories, where solid ingredients play a vital role in maintaining consistency and taste.
The flavor compounds segment captured 24.3% share in 2024. Natural flavoring agents sourced from botanicals, fruits, vegetables, and herbs are becoming indispensable for food and beverage formulations that aim to achieve complex and authentic taste profiles without artificial additives. The use of essential oils, fermentation-derived compounds, and plant-based extracts is expanding rapidly as consumers increasingly associate natural flavor with quality, safety, and sensory satisfaction.
North America Clean Label Ingredients Market is expected to record a CAGR of 12.4% between 2025 and 2034, driven by consumer preference for minimally processed, natural, and transparent ingredients. The region's market growth is supported by the rising adoption of clean label formulations across leading brands that focus on health, wellness, and sustainability. Technological innovations in natural preservation, extraction, and formulation are improving product performance while maintaining purity. Moreover, companies are prioritizing sustainable sourcing, investing in renewable raw materials, and expanding organic ingredient portfolios to meet consumer expectations and regulatory standards.
Leading companies operating in the Global Clean Label Ingredients Market include A&B Ingredients, Cargill, DSM-Firmenich, Limagrain Ingredients, Kerry Group, ADM, Ingredion, Corbion, International Flavors & Fragrances Inc. (IFF), Brisan Group, Tate & Lyle, and Novozymes. Key market players are adopting a range of strategies to strengthen their foothold in the Clean Label Ingredients Market. These include strategic partnerships with food manufacturers, expansion of regional production facilities, and acquisition of niche natural ingredient companies to broaden product portfolios. Continuous investment in research and development allows firms to introduce innovative and sustainable clean-label formulations that cater to evolving consumer trends.
Table of Contents
Chapter 1 Methodology & Scope
- 1.1 Market scope and definition
- 1.2 Research design
- 1.2.1 Research approach
- 1.2.2 Data collection methods
- 1.3 Data mining sources
- 1.3.1 Global
- 1.3.2 Regional/Country
- 1.4 Base estimates and calculations
- 1.4.1 Base year calculation
- 1.4.2 Key trends for market estimation
- 1.5 Primary research and validation
- 1.5.1 Primary sources
- 1.6 Forecast model
- 1.7 Research assumptions and limitations
Chapter 2 Executive Summary
- 2.1 Industry 360° synopsis
- 2.2 Key market trends
- 2.2.1 Form trends
- 2.2.2 Category trends
- 2.2.3 End Use industry trends
- 2.2.4 Regional trends
- 2.3 TAM Analysis, 2025-2034
- 2.4 CXO perspectives: strategic imperatives
- 2.4.1 Executive decision points
- 2.4.2 Critical success factors
- 2.5 Future outlook and strategic recommendations
Chapter 3 Industry Insights
- 3.1 Industry ecosystem analysis
- 3.1.1 Supplier landscape
- 3.1.2 Profit margin
- 3.1.3 Value addition at each stage
- 3.1.4 Factor affecting the value chain
- 3.1.5 Disruptions
- 3.2 Industry impact forces
- 3.2.1 Growth drivers
- 3.2.1.1 Rising consumer demand for transparency & natural ingredients
- 3.2.1.2 Regulatory push for cleaner labels & reduced synthetic additives
- 3.2.1.3 Health & wellness trends driving premium product demand
- 3.2.2 Industry pitfalls and challenges
- 3.2.2.1 Higher costs of natural vs synthetic ingredients
- 3.2.2.2 Technical challenges in maintaining product functionality
- 3.2.3 Market opportunities
- 3.2.3.1 Emerging applications in plant-based & alternative proteins
- 3.2.3.2 Advanced processing technology adoption
- 3.2.1 Growth drivers
- 3.3 Growth potential analysis
- 3.4 Regulatory landscape
- 3.4.1 North America
- 3.4.2 Europe
- 3.4.3 Asia Pacific
- 3.4.4 Latin America
- 3.4.5 Middle East & Africa
- 3.5 Porter's analysis
- 3.6 PESTEL analysis
- 3.7 Technology and Innovation landscape
- 3.7.1 Current technological trends
- 3.7.2 Emerging technologies
- 3.8 Price trends
- 3.8.1 By region
- 3.8.2 By product
- 3.9 Future market trends
- 3.10 Patent landscape
- 3.11 Trade statistics (HS code)( Note: the trade statistics will be provided for key countries only)
- 3.11.1 Major importing countries
- 3.11.2 Major exporting countries
- 3.12 Sustainability and environmental aspects
- 3.12.1 Sustainable practices
- 3.12.2 Waste reduction strategies
- 3.12.3 Energy efficiency in production
- 3.12.4 Eco-friendly initiatives
- 3.13 Carbon footprint consideration
Chapter 4 Competitive Landscape, 2024
- 4.1 Introduction
- 4.2 Company market share analysis
- 4.2.1 By region
- 4.2.1.1 North America
- 4.2.1.2 Europe
- 4.2.1.3 Asia Pacific
- 4.2.1.4 LATAM
- 4.2.1.5 MEA
- 4.2.1 By region
- 4.3 Company matrix analysis
- 4.4 Competitive analysis of major market players
- 4.5 Competitive positioning matrix
- 4.6 Key developments
- 4.6.1 Mergers & acquisitions
- 4.6.2 Partnerships & collaborations
- 4.6.3 New product launches
- 4.6.4 Expansion plans
Chapter 5 Market Estimates and Forecast, By Form, 2021-2034 (USD Billion) (Kilo Tons)
- 5.1 Key trends
- 5.2 Solid
- 5.2.1 Powder & granular
- 5.2.2 Crystalline & flake
- 5.2.3 Tablet & compressed forms
- 5.3 Liquid
- 5.3.1 Solutions & syrups
- 5.3.2 Emulsions & suspensions
- 5.3.3 Concentrated liquids
- 5.4 Semi-solid
- 5.4.1 Pastes & concentrates
- 5.4.2 Gels & viscous solutions
- 5.4.3 Wax & solid dispersions
Chapter 6 Market Estimates and Forecast, By Category, 2021-2034 (USD Billion) (Kilo Tons)
- 6.1 Key trends
- 6.2 Preservatives & antimicrobials
- 6.2.1 Organic acids (citric, acetic, lactic)
- 6.2.2 Essential oil compounds
- 6.2.3 Plant extract antioxidants
- 6.2.4 Salt & mineral-based preservatives
- 6.3 Colorants & pigments
- 6.3.1 Anthocyanins & betalains
- 6.3.2 Carotenoids & xanthophylls
- 6.3.3 Chlorophyll derivatives
- 6.3.4 Mineral & clay-based colors
- 6.4 Flavor compounds
- 6.4.1 Essential oils & oleoresins
- 6.4.2 Natural flavor extracts
- 6.4.3 Botanical aromatics
- 6.4.4 Taste modulators & enhancers
- 6.5 Sweetening agents
- 6.5.1 High-intensity sweeteners (stevia, monk fruit)
- 6.5.2 Sugar alcohols (erythritol, xylitol)
- 6.5.3 Rare sugars (allulose, tagatose)
- 6.5.4 Natural sugar alternatives
- 6.6 Proteins & amino acids
- 6.6.1 Plant protein concentrates
- 6.6.2 Protein isolates & hydrolysates
- 6.6.3 Essential amino acid blends
- 6.6.4 Bioactive peptides
- 6.7 Texturizing agents
- 6.7.1 Thickening compounds
- 6.7.2 Gelling agents
- 6.7.3 Stabilizing systems
- 6.7.4 Anti-caking agents
- 6.8 Others
Chapter 7 Market Estimates and Forecast, By End Use Industry, 2021-2034 (USD Billion) (Kilo Tons)
- 7.1 Key trends
- 7.2 Beverages industry
- 7.2.1 Non-alcoholic beverages
- 7.2.2 Alcoholic beverages
- 7.2.3 Functional & sports drinks
- 7.2.4 Dairy-based beverages
- 7.3 Food manufacturing
- 7.3.1 Bakery & cereal products
- 7.3.2 Confectionery & sweets
- 7.3.3 Processed foods & ready meals
- 7.3.4 Snack foods & convenience products
- 7.4 Dairy & alternatives industry
- 7.4.1 Traditional dairy products
- 7.4.2 Plant-based dairy alternatives
- 7.4.3 Fermented dairy products
- 7.4.4 Frozen dairy desserts
- 7.5 Meat & protein industry
- 7.5.1 Processed meat products
- 7.5.2 Plant-based meat alternatives
- 7.5.3 Seafood & marine products
- 7.5.4 Protein supplements & bars
- 7.6 Specialized nutrition
- 7.6.1 Infant & baby nutrition
- 7.6.2 Clinical & medical nutrition
- 7.6.3 Sports & performance nutrition
- 7.6.4 Senior & geriatric nutrition
- 7.7 Food service & catering
- 7.7.1 Restaurant & qsr chains
- 7.7.2 Institutional catering
- 7.7.3 Food ingredients Supply
- 7.8 Others
Chapter 8 Market Estimates and Forecast, By Region, 2021-2034 (USD Billion) (Kilo Tons)
- 8.1 Key trends
- 8.2 North America
- 8.2.1 U.S.
- 8.2.2 Canada
- 8.3 Europe
- 8.3.1 Germany
- 8.3.2 UK
- 8.3.3 France
- 8.3.4 Spain
- 8.3.5 Italy
- 8.3.6 Rest of Europe
- 8.4 Asia Pacific
- 8.4.1 China
- 8.4.2 India
- 8.4.3 Japan
- 8.4.4 Australia
- 8.4.5 South Korea
- 8.4.6 Rest of Asia Pacific
- 8.5 Latin America
- 8.5.1 Brazil
- 8.5.2 Mexico
- 8.5.3 Argentina
- 8.5.4 Rest of Latin America
- 8.6 Middle East and Africa
- 8.6.1 Saudi Arabia
- 8.6.2 South Africa
- 8.6.3 UAE
- 8.6.4 Rest of Middle East and Africa
Chapter 9 Company Profiles
- 9.1 A&B Ingredients
- 9.2 ADM
- 9.3 Brisan Group
- 9.4 Cargill
- 9.5 Corbion
- 9.6 DSM-Firmenich
- 9.7 Ingredion
- 9.8 International Flavors & Fragrances Inc. (IFF)
- 9.9 Kerry Group
- 9.10 Limagrain Ingredients
- 9.11 Novozymes
- 9.12 Tate & Lyle

