
PUBLISHER: Global Market Insights Inc. | PRODUCT CODE: 1666997

PUBLISHER: Global Market Insights Inc. | PRODUCT CODE: 1666997
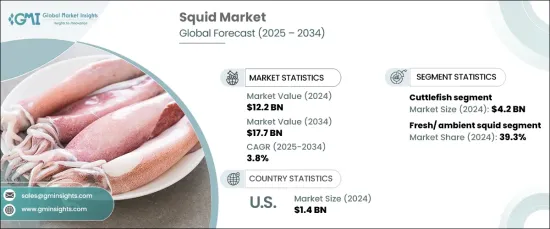
Squid Market Opportunity, Growth Drivers, Industry Trend Analysis, and Forecast 2025 - 2034
The Global Squid Market was valued at USD 12.2 billion in 2024 and is set to grow at a steady CAGR of 3.8% from 2025 to 2034. As consumer appetite for exotic seafood continues to rise, squid has earned its place as a highly sought-after delicacy in many cuisines around the world. Known for its unique flavor profile and versatility, squid is featured in a variety of forms, from whole fresh squid to popular processed items like dried squid snacks, calamari rings, and squid steaks. The surge in demand for premium seafood options, driven by growing consumer interest in new culinary experiences, has further propelled the squid market expansion.
The squid market has seen notable growth thanks to advancements in packaging, distribution, and logistics, ensuring that fresh and processed squid reach international markets more effectively than ever before. Increased consumer awareness of seafood's health benefits, including high protein and low-fat content, has also contributed to this surge in demand. Additionally, squid plays a vital role in many high-end restaurants and Mediterranean, Japanese, and other Asian cuisines, strengthening its place in the global food scene. However, the industry faces significant hurdles, including the threats posed by overfishing and climate change, which impact supply chains and availability. In response to these challenges, sustainable aquaculture initiatives and fisheries regulations are helping stabilize the market, offering solutions to secure the squid supply in the long term.
| Market Scope | |
|---|---|
| Start Year | 2024 |
| Forecast Year | 2025-2034 |
| Start Value | $12.2 Billion |
| Forecast Value | $17.7 Billion |
| CAGR | 3.8% |
Squid products are categorized by species type, with Japanese flying squid, cuttlefish, Argentine shortfin squid, and European squid being the main contenders. The cuttlefish segment was the leading market contributor in 2024, generating USD 4.2 billion in revenue. Cuttlefish, known for their tender texture and rich flavor, continue to dominate due to their broad consumer appeal. European squid is also a prominent player in the market, especially in European households and restaurants, thanks to its versatility and culinary value.
The market is further divided by product form, with fresh/ambient squid, chilled squid, and frozen squid being the primary categories. Fresh/ambient squid accounted for 39.3% of the total market share in 2024 and is the fastest-growing segment. The rising demand for high-quality, minimally processed seafood has made fresh squid particularly popular among premium food establishments. These products are especially coveted in Mediterranean, Japanese, and other Asian cuisines, where squid is an essential ingredient.
In the U.S. market, squid was valued at USD 1.4 billion in 2024, driven by an increasing consumer preference for seafood as a healthy protein alternative. The popularity of Mediterranean and Asian dishes featuring squid-based meals has also contributed to this growth. Sustainable fishing practices along the U.S. coastline and improvements in cold-chain logistics have ensured a steady and reliable supply of both fresh and frozen squid to meet growing demand.
Table of Contents
Chapter 1 Methodology & Scope
- 1.1 Market scope & definitions
- 1.2 Base estimates & calculations
- 1.3 Forecast calculations
- 1.4 Data sources
- 1.4.1 Primary
- 1.4.2 Secondary
- 1.4.2.1 Paid sources
- 1.4.2.2 Public sources
Chapter 2 Executive Summary
- 2.1 Industry synopsis, 2021-2034
Chapter 3 Industry Insights
- 3.1 Industry ecosystem analysis
- 3.1.1 Factor affecting the value chain
- 3.1.2 Profit margin analysis
- 3.1.3 Disruptions
- 3.1.4 Future outlook
- 3.1.5 Manufacturers
- 3.1.6 Distributors
- 3.2 Supplier landscape
- 3.3 Profit margin analysis
- 3.4 Key news & initiatives
- 3.5 Regulatory landscape
- 3.6 Impact forces
- 3.6.1 Growth drivers
- 3.6.1.1 Rising seafood consumption
- 3.6.1.2 Growing popularity of ethnic cuisines
- 3.6.1.3 Health benefits associated with squid
- 3.6.2 Industry pitfalls & challenges
- 3.6.2.1 Overfishing
- 3.6.2.2 Price volatility of squid
- 3.6.1 Growth drivers
- 3.7 Growth potential analysis
- 3.8 Porter’s analysis
- 3.9 PESTEL analysis
Chapter 4 Competitive Landscape, 2024
- 4.1 Introduction
- 4.2 Company market share analysis
- 4.3 Competitive positioning matrix
- 4.4 Strategic outlook matrix
Chapter 5 Market Estimates & Forecast, By Type, 2021-2034 (USD Billion) (Kilo Tons)
- 5.1 Key trends
- 5.2 Cuttlefish
- 5.3 European squid
- 5.4 Argentine shortfin squid
- 5.5 Jumbo flying squid
- 5.6 Japanese flying squid
- 5.7 Others
Chapter 6 Market Estimates & Forecast, By Category, 2021-2034 (USD Billion) (Kilo Tons)
- 6.1 Key trends
- 6.2 Fresh/ ambient squid
- 6.3 Frozen squid
- 6.4 Chilled squid
- 6.5 Others
Chapter 7 Market Estimates & Forecast, By Packaging, 2021-2034 (USD Billion) (Kilo Tons)
- 7.1 Key trends
- 7.2 Cans
- 7.3 Trays
- 7.4 Others
Chapter 8 Market Estimates & Forecast, By Distribution Channel, 2021-2034 (USD Billion) (Kilo Tons)
- 8.1 Key trends
- 8.1.1 Food retail
- 8.1.1.1 Supermarket
- 8.1.1.2 Hypermarket
- 8.1.1.3 Specialty store
- 8.1.1.4 Others
- 8.1.2 Food service
- 8.1.1 Food retail
Chapter 9 Market Estimates & Forecast, By Region, 2021-2034 (USD Billion) (Kilo Tons)
- 9.1 Key trends
- 9.2 North America
- 9.2.1 U.S.
- 9.2.2 Canada
- 9.3 Europe
- 9.3.1 UK
- 9.3.2 Germany
- 9.3.3 France
- 9.3.4 Italy
- 9.3.5 Spain
- 9.3.6 Russia
- 9.4 Asia Pacific
- 9.4.1 China
- 9.4.2 India
- 9.4.3 Japan
- 9.4.4 South Korea
- 9.4.5 Australia
- 9.5 Latin America
- 9.5.1 Brazil
- 9.5.2 Mexico
- 9.6 MEA
- 9.6.1 South Africa
- 9.6.2 Saudi Arabia
- 9.6.3 UAE
Chapter 10 Company Profiles
- 10.1 Bigsams
- 10.2 Freshkatch
- 10.3 Holmes
- 10.4 Holt
- 10.5 Lee Fishing
- 10.6 Minh Khue
- 10.7 Pescanova
- 10.8 Qingdao Seaflying Food
- 10.9 Seafood Pride International
- 10.10 Seaquest
- 10.11 Thai Union
- 10.12 Xiamen Taiseng

