
PUBLISHER: Global Market Insights Inc. | PRODUCT CODE: 1667135

PUBLISHER: Global Market Insights Inc. | PRODUCT CODE: 1667135
Hops Market Opportunity, Growth Drivers, Industry Trend Analysis, and Forecast 2025 - 2034
The Global Hops Market was valued at USD 8.8 billion in 2024 and is projected to grow at a CAGR of 6.1% from 2025 to 2034. The increasing demand for diverse beer styles, particularly those enriched with hops for flavor and aroma, is a major driver of the market. Brewers are increasingly sourcing unique hop varieties to craft innovative and flavorful beers, fueling the need for a wider range of options. Innovation in hop cultivation, breeding, and processing is also playing a critical role in propelling market growth, as research and development efforts focus on creating novel hop types with distinctive taste profiles and improved resistance to diseases. Sustainable farming techniques and expanding applications for hops in industries such as cosmetics and pharmaceuticals further open new growth avenues. These factors collectively ensure a consistent supply of high-quality hops, catering to the evolving preferences of consumers and industrial demands.
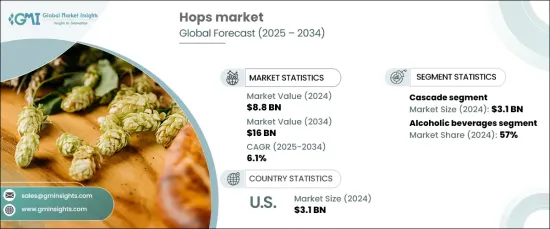
In terms of product segmentation, the hops market is categorized into various types, including cascade, chinook, amarillo, centennial, and others. Cascade accounted for a significant share of the market, generating a revenue of USD 3.1 billion in 2024. Its widespread popularity stems from its ability to enhance beers with vibrant, unique flavors, making it an essential ingredient for crafting complex and appealing beverages. This versatility has solidified its position as a favored choice among brewers.
| Market Scope | |
|---|---|
| Start Year | 2024 |
| Forecast Year | 2025-2034 |
| Start Value | $8.8 Billion |
| Forecast Value | $16 Billion |
| CAGR | 6.1% |
The application landscape of the hops market includes alcoholic beverages, pharmaceuticals, cosmetics, and other segments. Alcoholic beverages dominated the market with a commanding 57% share in 2024. Hops play a crucial role in creating a balanced taste in beers by providing flavor, bitterness, and aroma, complementing the sweetness of malt. They are extensively utilized in a variety of beverages, including lagers, stouts, ales, and specialty brews. The continued demand for unique and bold flavor profiles contributes to the growing adoption of hops in the beverage industry.
The US hops market reached a valuation of USD 3.1 billion in 2024, driven by a thriving craft beer industry and a growing preference for premium-quality brews. Ideal climatic conditions and advanced farming practices, particularly in regions known for their hop production, further enhance market dynamics. The rise of sustainable and organic farming practices also aligns with consumer demands for high-quality ingredients, providing additional momentum to the industry. These factors position the US as a key player in the global hops market, ensuring sustained growth in the years ahead.
Table of Contents
Chapter 1 Methodology & Scope
- 1.1 Market scope & definitions
- 1.2 Base estimates & calculations
- 1.3 Forecast calculations
- 1.4 Data sources
- 1.4.1 Primary
- 1.4.2 Secondary
- 1.4.2.1 Paid sources
- 1.4.2.2 Public sources
Chapter 2 Executive Summary
- 2.1 Industry synopsis, 2021-2034
Chapter 3 Industry Insights
- 3.1 Industry ecosystem analysis
- 3.1.1 Factor affecting the value chain
- 3.1.2 Profit margin analysis
- 3.1.3 Disruptions
- 3.1.4 Future outlook
- 3.1.5 Manufacturers
- 3.1.6 Distributors
- 3.2 Supplier landscape
- 3.3 Profit margin analysis
- 3.4 Key news & initiatives
- 3.5 Regulatory landscape
- 3.6 Impact forces
- 3.6.1 Growth drivers
- 3.6.1.1 Increasing popularity of craft beer
- 3.6.1.2 Expanding microbrewery industry
- 3.6.1.3 Increasing demand for unique flavors
- 3.6.2 Industry pitfalls & challenges
- 3.6.2.1 Competition from substitutes
- 3.6.2.2 Rising production costs
- 3.6.1 Growth drivers
- 3.7 Growth potential analysis
- 3.8 Porter’s analysis
- 3.9 PESTEL analysis
Chapter 4 Competitive Landscape, 2024
- 4.1 Introduction
- 4.2 Company market share analysis
- 4.3 Competitive positioning matrix
- 4.4 Strategic outlook matrix
Chapter 5 Market Estimates & Forecast, By Type, 2021-2034 (USD Billion) (Kilo Tons)
- 5.1 Key trends
- 5.2 Cascade
- 5.3 Chinook
- 5.4 Amarillo
- 5.5 Centennial
- 5.6 Others (e.g., citra, galaxy, simcoe)
Chapter 6 Market Estimates & Forecast, By Application, 2021-2034 (USD Billion) (Kilo Tons)
- 6.1 Key trends
- 6.2 Alcoholic beverages
- 6.3 Pharmaceuticals
- 6.4 Cosmetics
- 6.5 Others
Chapter 7 Market Estimates & Forecast, By Region, 2021-2034 (USD Billion) (Kilo Tons)
- 7.1 Key trends
- 7.2 North America
- 7.2.1 U.S.
- 7.2.2 Canada
- 7.3 Europe
- 7.3.1 UK
- 7.3.2 Germany
- 7.3.3 France
- 7.3.4 Italy
- 7.3.5 Spain
- 7.3.6 Russia
- 7.4 Asia Pacific
- 7.4.1 China
- 7.4.2 India
- 7.4.3 Japan
- 7.4.4 South Korea
- 7.4.5 Australia
- 7.5 Latin America
- 7.5.1 Brazil
- 7.5.2 Mexico
- 7.6 MEA
- 7.6.1 South Africa
- 7.6.2 Saudi Arabia
- 7.6.3 UAE
Chapter 8 Company Profiles
- 8.1 Ausmauco Biotech
- 8.2 Barth-Haas Group
- 8.3 Brewers Select Limited
- 8.4 Carlsberg Breweries
- 8.5 DVKSP Impex
- 8.6 Heineken
- 8.7 Hop Head Farms
- 8.8 Hops Direct
- 8.9 John I. Haas
- 8.10 New Zealand Hops
- 8.11 Sapporo Holdings
- 8.12 Steiner Hops
- 8.13 Styrian Hops
- 8.14 The Hop Planter Association Tettnang
- 8.15 Yakima Chief Hops

