
PUBLISHER: Global Market Insights Inc. | PRODUCT CODE: 1721515

PUBLISHER: Global Market Insights Inc. | PRODUCT CODE: 1721515
Distribution Automation Market Opportunity, Growth Drivers, Industry Trend Analysis, and Forecast 2025 - 2034
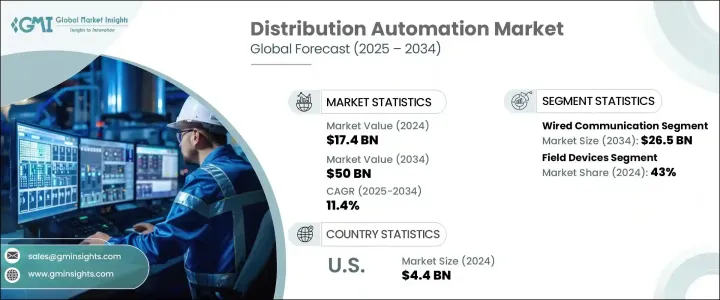
The Global Distribution Automation Market was valued at USD 17.4 billion in 2024 and is estimated to grow at a CAGR of 11.4% to reach USD 50 billion by 2034. The market is witnessing remarkable momentum as utilities worldwide embrace advanced technologies to modernize power grids. Rising energy demands, increasing integration of renewable energy sources, and heightened concerns around grid reliability and resilience are pushing both public and private sector players to prioritize distribution automation solutions. Governments and utility providers are rapidly investing in automation to reduce power outages, enhance energy efficiency, and support a sustainable electricity infrastructure.
With aging electrical infrastructure and surging electrification trends across urban and rural areas alike, automated distribution networks are emerging as a critical pillar in the transition toward smarter energy systems. Automation is also proving essential in handling real-time power consumption data and improving asset management capabilities, enabling utilities to respond faster to faults and balance energy supply more effectively. As digital transformation continues to reshape energy infrastructure, distribution automation systems are becoming indispensable in the global effort to build a reliable, secure, and adaptive energy grid.
| Market Scope | |
|---|---|
| Start Year | 2024 |
| Forecast Year | 2025-2034 |
| Start Value | $17.4 Billion |
| Forecast Value | $50 Billion |
| CAGR | 11.4% |
The growing demand for grid modernization, the implementation of smart grids, and the need for reliable power distribution are the primary drivers of this market. Utilities are increasingly turning to automation solutions to enhance efficiency, reduce operational costs, and provide a more stable and reliable power supply to consumers. Distribution automation is gaining traction globally as part of the larger push toward smarter, more resilient infrastructure, aiming to improve grid performance and support the integration of renewable energy sources.
Wired communication remains the dominant segment within the market and is projected to grow by USD 26.5 billion by 2034. Fiber optics and Ethernet networks, known for their stability, low latency, and resistance to interference, continue to help in high-reliability applications. Utility companies rely heavily on wired networks for functions like SCADA systems and real-time monitoring of the grid, ensuring that critical operations run smoothly.
The field devices segment, which includes smart reclosers, automated switches, and fault indicators, accounted for a 43% share in 2024, as these devices integrate with IoT and edge computing to improve the reliability and efficiency of power grids. These devices are essential for improving the functionality and reliability of power grids. By integrating with Internet of Things (IoT) technology and edge computing, these devices enhance real-time monitoring, predictive maintenance, and fault detection capabilities. Smart reclosers are particularly important for automatically detecting faults and restoring power after temporary disruptions, significantly reducing the duration of outages.
U.S. Distribution Automation Market generated USD 4.4 billion in 2024. The growth is attributed to advancements in grid systems, the adoption of renewable energy sources, and the increasing deployment of innovative technologies. Federal and state policies aimed at improving energy efficiency, along with the integration of 5G and edge networks for enhanced monitoring and control, are further driving the expansion of this market. The adoption of artificial intelligence and IoT-based systems is enabling utilities to optimize operations, reduce downtime, and enhance grid resilience.
Key players in the Global Distribution Automation Market include Landis+Gyr, ABB, Cisco, Eaton, GE, G&W Electric, S&C Electric Company, Hubbell, Itron, NovaTech, Schneider Electric, Hitachi, Schweitzer Engineering Laboratories, Siemens, Toshiba Energy Systems & Solutions, Trilliant Holdings, and Xylem. To strengthen their presence, companies in the distribution automation market are focusing on technological innovation and product development. Many are investing in AI-based automation and IoT solutions to improve grid management and optimize energy distribution. Partnerships with utilities and energy providers are also a significant strategy, allowing companies to tailor solutions to specific needs and expand their reach. Additionally, companies are exploring mergers and acquisitions to diversify their offerings and enter new regional markets. Increased investment in cybersecurity solutions is another key strategy to address the growing concerns related to grid security and data privacy.
Table of Contents
Chapter 1 Methodology & Scope
- 1.1 Market definitions
- 1.2 Base estimates & calculations
- 1.3 Forecast calculation
- 1.4 Data sources
- 1.4.1 Primary
- 1.4.2 Secondary
- 1.4.2.1 Paid
- 1.4.2.2 Public
Chapter 2 Executive Summary
- 2.1 Industry synopsis, 2021 - 2034
Chapter 3 Industry Insights
- 3.1 Industry ecosystem analysis
- 3.2 Regulatory landscape
- 3.3 Industry impact forces
- 3.3.1 Growth drivers
- 3.3.2 Industry pitfalls & challenges
- 3.4 Growth potential analysis
- 3.5 Porter's analysis
- 3.5.1 Bargaining power of suppliers
- 3.5.2 Bargaining power of buyers
- 3.5.3 Threat of new entrants
- 3.5.4 Threat of substitutes
- 3.6 PESTEL analysis
Chapter 4 Competitive landscape, 2024
- 4.1 Strategic dashboard
- 4.2 Innovation & sustainability landscape
Chapter 5 Market Size and Forecast, By Communication, 2021 - 2034 (USD Million)
- 5.1 Key trends
- 5.2 Wired
- 5.3 Wireless
Chapter 6 Market Size and Forecast, By Components, 2021 - 2034 (USD Million)
- 6.1 Key trends
- 6.2 Software
- 6.3 Field devices
- 6.4 Services
Chapter 7 Market Size and Forecast, By Application, 2021 - 2034 (USD Million)
- 7.1 Key trends
- 7.2 Public utility
- 7.3 Private utility
Chapter 8 Market Size and Forecast, By Region, 2021 - 2034 (USD Million)
- 8.1 Key trends
- 8.2 North America
- 8.2.1 U.S.
- 8.2.2 Canada
- 8.2.3 Mexico
- 8.3 Europe
- 8.3.1 UK
- 8.3.2 Germany
- 8.3.3 France
- 8.3.4 Spain
- 8.3.5 Italy
- 8.4 Asia Pacific
- 8.4.1 China
- 8.4.2 Australia
- 8.4.3 Japan
- 8.4.4 South Korea
- 8.4.5 India
- 8.5 Middle East & Africa
- 8.5.1 Saudi Arabia
- 8.5.2 UAE
- 8.5.3 South Africa
- 8.6 Latin America
- 8.6.1 Brazil
- 8.6.2 Chile
Chapter 9 Company Profiles
- 9.1 ABB
- 9.2 Cisco
- 9.3 Eaton
- 9.4 GE
- 9.5 G&W Electric
- 9.6 Hitachi
- 9.7 Hubbell
- 9.8 Itron
- 9.9 Landis+Gyr
- 9.10 NovaTech
- 9.11 Schneider Electric
- 9.12 Schweitzer Engineering Laboratories
- 9.13 S&C Electric Company
- 9.14 Siemens
- 9.15 Toshiba Energy Systems & Solutions
- 9.16 Trilliant Holdings
- 9.17 Xylem

