
PUBLISHER: Global Market Insights Inc. | PRODUCT CODE: 1666560

PUBLISHER: Global Market Insights Inc. | PRODUCT CODE: 1666560
Manual Lifting Mobile Light Tower Market Opportunity, Growth Drivers, Industry Trend Analysis, and Forecast 2025 - 2034
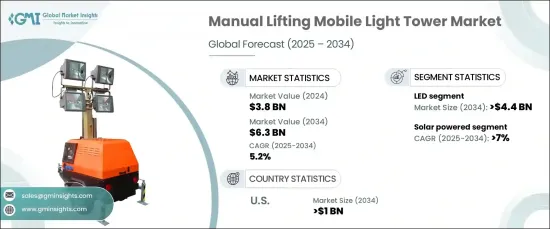
The Global Manual Lifting Mobile Light Tower Market, valued at USD 3.8 billion in 2024, is expected to expand at a CAGR of 5.2% from 2025 to 2034. This growth is primarily driven by the rising demand for lighting solutions in remote and off-grid locations, along with a surge in construction and mining activities. Technological innovations have significantly contributed to enhancing the performance, durability, and efficiency of mobile light towers, making them more versatile for diverse applications.
The increasing shift toward sustainable energy solutions has also played a major role, with a notable focus on solar and hybrid-powered light towers as environmentally friendly alternatives. The growing need for portable and reliable lighting solutions in outdoor settings, especially in emergency and industrial applications, is further propelling market expansion. The market is also benefitting from the growing adoption of rental services and strong distribution networks, which improve the accessibility and availability of these products globally.
| Market Scope | |
|---|---|
| Start Year | 2024 |
| Forecast Year | 2025-2034 |
| Start Value | $3.8 Billion |
| Forecast Value | $6.3 Billion |
| CAGR | 5.2% |
LED mobile light towers, a significant part of the market, are projected to surpass USD 4.4 billion by 2034. Their long-lasting performance, low energy consumption, and superior lighting capabilities have made them a preferred choice in industries such as construction and outdoor events. Manufacturers are continuing to enhance lighting efficiency by incorporating advanced optics and offering customizable lighting configurations. Hybrid power systems, which combine solar energy with traditional power sources, are becoming increasingly popular due to their ability to provide uninterrupted power in various operational environments.
The solar-powered segment of the manual lifting mobile light tower market is expected to see strong growth, with a projected CAGR of over 7% through 2034. As more businesses and industries adopt sustainable practices, the demand for solar-powered light towers continues to rise. These solutions offer the advantage of reduced operational costs and a minimal carbon footprint, aligning with global sustainability goals. Hybrid systems, which combine solar power with backup generators, are gaining traction, especially in off-grid locations where continuous power is essential. The introduction of battery-powered light towers, which operate silently and without emissions, is also transforming the market, catering to a variety of applications, including urban settings and large-scale events.
In the U.S., the manual lifting mobile light tower market is anticipated to reach USD 1 billion by 2034. This growth is attributed to increased demand in sectors such as construction, emergency services, and outdoor events. The widespread adoption of energy-efficient LED lighting systems is driving the market, with a strong focus on reducing energy consumption and operational costs. Additionally, the push for sustainability has led to an increasing preference for solar-powered and hybrid-powered light towers, contributing to a significant shift in the market's landscape.
Table of Contents
Chapter 1 Methodology & Scope
- 1.1 Market definitions
- 1.2 Base estimates & calculations
- 1.3 Forecast calculation
- 1.4 Data sources
- 1.4.1 Primary
- 1.4.2 Secondary
- 1.4.2.1 Paid
- 1.4.2.2 Public
Chapter 2 Executive Summary
- 2.1 Industry synopsis, 2021 - 2034
Chapter 3 Industry Insights
- 3.1 Industry ecosystem analysis
- 3.2 Regulatory landscape
- 3.3 Industry impact forces
- 3.3.1 Growth drivers
- 3.3.2 Industry pitfalls & challenges
- 3.4 Growth potential analysis
- 3.5 Porter's analysis
- 3.5.1 Bargaining power of suppliers
- 3.5.2 Bargaining power of buyers
- 3.5.3 Threat of new entrants
- 3.5.4 Threat of substitutes
- 3.6 PESTEL analysis
Chapter 4 Competitive Landscape, 2024
- 4.1 Strategic dashboard
- 4.2 Innovation & sustainability landscape
Chapter 5 Market Size and Forecast, By Lighting, 2021 – 2034 (USD Million, ‘000 Units)
- 5.1 Key trends
- 5.2 Metal halide
- 5.3 LED
- 5.4 Electric
- 5.5 Others
Chapter 6 Market Size and Forecast, By Power Source, 2021 – 2034 (USD Million, ‘000 Units)
- 6.1 Key trends
- 6.2 Diesel
- 6.3 Solar
- 6.4 Direct
- 6.5 Others
Chapter 7 Market Size and Forecast, By Application, 2021 – 2034 (USD Million, ‘000 Units)
- 7.1 Key trends
- 7.2 Construction
- 7.3 Infrastructure development
- 7.4 Oil & gas
- 7.5 Mining
- 7.6 Military & defense
- 7.7 Emergency & disaster relief
- 7.8 Others
Chapter 8 Market Size and Forecast, By Region, 2021 – 2034 (USD Million, ‘000 Units)
- 8.1 Key trends
- 8.2 North America
- 8.2.1 U.S.
- 8.2.2 Canada
- 8.2.3 Mexico
- 8.3 Europe
- 8.3.1 Germany
- 8.3.2 UK
- 8.3.3 France
- 8.3.4 Italy
- 8.3.5 Spain
- 8.3.6 Russia
- 8.4 Asia Pacific
- 8.4.1 China
- 8.4.2 Japan
- 8.4.3 India
- 8.4.4 Australia
- 8.4.5 South Korea
- 8.5 Middle East & Africa
- 8.5.1 Saudi Arabia
- 8.5.2 UAE
- 8.5.3 Qatar
- 8.5.4 South Africa
- 8.6 Latin America
- 8.6.1 Brazil
- 8.6.2 Argentina
Chapter 9 Company Profiles
- 9.1 Allmand Bros
- 9.2 Aska Equipments
- 9.3 Atlas Copco
- 9.4 Caterpillar
- 9.5 Chicago Pneumatic
- 9.6 Colorado Standby
- 9.7 DMI
- 9.8 Doosan Portable Power
- 9.9 Generac Power Systems
- 9.10 HIMOINSA
- 9.11 Inmesol gensets
- 9.12 J C Bamford Excavators
- 9.13 LARSON Electronics
- 9.14 Light Boy
- 9.15 LTA Projects
- 9.16 Multiquip
- 9.17 Olikara Lighting Towers
- 9.18 Progress Solar Solutions
- 9.19 The Will Burt Company
- 9.20 Trime
- 9.21 United Rentals
- 9.22 Wacker Neuson
- 9.23 Youngman Richardson

