
PUBLISHER: Global Market Insights Inc. | PRODUCT CODE: 1755349

PUBLISHER: Global Market Insights Inc. | PRODUCT CODE: 1755349
Equine Healthcare Market Opportunity, Growth Drivers, Industry Trend Analysis, and Forecast 2025 - 2034
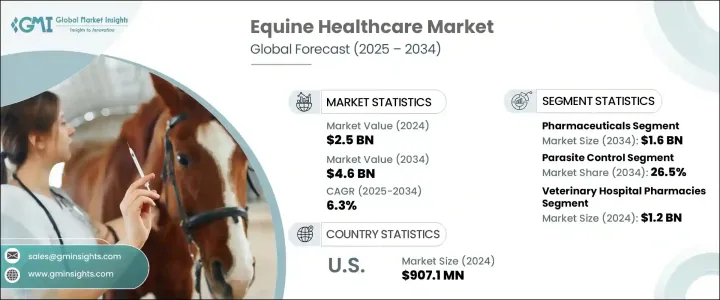
The Global Equine Healthcare Market was valued at USD 2.5 billion in 2024 and is estimated to grow at a CAGR of 6.3% to reach USD 4.6 billion by 2034. The expansion of this market is primarily attributed to rising animal healthcare spending and an increasing emphasis on preventive care and early diagnosis among horse owners, breeders, and veterinarians. This heightened awareness has significantly increased the demand for equine healthcare products and services. The rise in musculoskeletal disorders and equine infectious diseases has also driven the adoption of advanced diagnostics and treatments.
Furthermore, the market is benefiting from a continuous focus on developing innovative therapeutics such as regenerative medicines, targeted therapies, and digital health monitoring tools. Demand is also being propelled by growing investments in the equine sports and racing sectors. As the occurrence of equine-related diseases increases, so does the need for more effective and accessible treatment options. The strengthening of veterinary infrastructure and rising investments from pharmaceutical companies in proprietary equine medications are also playing a critical role in accelerating growth. The trend of pet humanization within the equine segment is further contributing to technological advancements and sustained demand for modern healthcare solutions tailored for horses.
| Market Scope | |
|---|---|
| Start Year | 2024 |
| Forecast Year | 2025-2034 |
| Start Value | $2.5 Billion |
| Forecast Value | $4.6 Billion |
| CAGR | 6.3% |
Equine healthcare refers to the holistic approach to maintaining and improving horse health through prevention, diagnosis, and treatment of various conditions. The market covers a wide range of medical and diagnostic offerings delivered by veterinarians, pharmaceutical firms, and dedicated equine clinics. These solutions ensure the overall wellness and peak performance of horses used in breeding, recreation, and sports.
In terms of product categories, the global equine healthcare market is segmented into vaccines, pharmaceuticals, diagnostics, medicinal feed additives, and others. Among these, the pharmaceuticals segment led the market in 2024 with a revenue share of USD 817.9 million and is expected to reach USD 1.6 billion by 2034, growing at a CAGR of 6.6%. This segment includes products such as anti-infectives, parasiticides, anti-inflammatories, analgesics, and other pharmaceutical treatments. The segment's dominance is driven by rising demand for advanced therapies targeting common equine conditions like respiratory, musculoskeletal, and infectious diseases. Moreover, the increased involvement in recreational riding and competitive events underscores the need for superior health management protocols.
The market by indication is categorized into parasite control, musculoskeletal disorders, equine influenza, equine encephalomyelitis, equine herpes, West Nile virus, tetanus, and others. The parasite control segment captured a 25.1% market share in 2024 and is forecasted to reach 26.5% by 2034. This segment continues to play a pivotal role due to the widespread need to manage harmful parasites that compromise a horse's health and performance. Internal and external parasites can trigger gastrointestinal distress, coat degradation, and weight issues. Rising awareness among horse caretakers and veterinarians around preventive parasite management is pushing the demand for anthelmintics and other control measures. Changing climatic patterns and year-round access to pasturelands have amplified exposure to parasites, boosting the need for innovative and effective therapeutics.
By distribution channel, the market is segmented into veterinary hospital pharmacies, e-commerce, and others. Veterinary hospital pharmacies dominated the market in 2024 with a valuation of USD 1.2 billion and are projected to maintain their lead through 2034, growing at a CAGR of 6.7%. These pharmacies are preferred due to their comprehensive services, which include professional consultation, treatment, and access to a wide variety of equine medications. Their integrated approach to diagnosis and therapy continues to make them a critical access point for horse owners.
Regionally, North America is projected to grow at a CAGR of 6.1% over the forecast period. The region's robust equine industry, heightened focus on animal welfare, and advanced veterinary infrastructure have positioned it as a leader in the equine healthcare space. A large horse population and widespread participation in equine activities further support the demand for specialized healthcare offerings across the region.
Key players shaping the global equine healthcare market include Heska Corporation, Chanelle Pharma, Ceva, Zoetis, Esaote, Alltech, Vetoquinol, Cargill, Dechra Pharmaceuticals, IDEXX Laboratories, Bentoii, Equal Pharma, Merck, Hallmarq Veterinary, Boehringer Ingelheim, and Intacin. These companies are actively involved in product innovation, strategic collaborations, and expanding their product portfolios to meet the evolving needs of the equine industry.
Table of Contents
Chapter 1 Methodology and Scope
- 1.1 Market scope and definition
- 1.2 Research design
- 1.2.1 Research approach
- 1.2.2 Data collection methods
- 1.3 Base estimates and calculations
- 1.3.1 Base year calculation
- 1.3.2 Key trends for market estimation
- 1.4 Forecast model
- 1.5 Primary research and validation
- 1.5.1 Primary sources
- 1.5.2 Data mining sources
Chapter 2 Executive Summary
- 2.1 Industry 360° synopsis
Chapter 3 Industry Insights
- 3.1 Industry ecosystem analysis
- 3.2 Industry impact forces
- 3.2.1 Growth drivers
- 3.2.1.1 Growing equine sports and recreational activities
- 3.2.1.2 Technological advancements in veterinary medicine
- 3.2.1.3 Increasing support offered by government and public organizations for animal care
- 3.2.2 Industry pitfalls and challenges
- 3.2.2.1 Lack of skilled veterinary professionals
- 3.2.1 Growth drivers
- 3.3 Growth potential analysis
- 3.4 Technology landscape
- 3.5 Pipeline analysis, by pharmaceuticals
- 3.6 Regulatory landscape
- 3.7 Future market trends
- 3.8 Gap Analysis
- 3.9 Porter's analysis
- 3.10 PESTEL analysis
Chapter 4 Competitive Landscape, 2024
- 4.1 Introduction
- 4.2 Company matrix analysis
- 4.3 Competitive analysis of major market players
- 4.4 Competitive positioning matrix
- 4.5 Strategy dashboard
Chapter 5 Market Estimates and Forecast, By Product, 2021 – 2034 ($ Mn)
- 5.1 Key trends
- 5.2 Vaccines
- 5.3 Pharmaceuticals
- 5.3.1 Parasiticides
- 5.3.2 Anti-infective
- 5.3.3 Anti-inflammatory and analgesics
- 5.3.4 Other pharmaceutical products
- 5.4 Medicinal feed additives
- 5.5 Diagnostics
- 5.6 Other products
Chapter 6 Market Estimates and Forecast, By Indication, 2021 – 2034 ($ Mn)
- 6.1 Key trends
- 6.2 Musculoskeletal disorders
- 6.3 Parasite control
- 6.4 Equine herpes
- 6.5 Equine encephalomyelitis
- 6.6 Equine influenza
- 6.7 Tetanus
- 6.8 West Nile Virus
- 6.9 Other indications
Chapter 7 Market Estimates and Forecast, By Distribution Channel, 2021 – 2034 ($ Mn)
- 7.1 Key trends
- 7.2 Veterinary hospital pharmacies
- 7.3 E-commerce
- 7.4 Other distribution channels
Chapter 8 Market Estimates and Forecast, By Region, 2021 – 2034 ($ Mn)
- 8.1 Key trends
- 8.2 North America
- 8.2.1 U.S.
- 8.2.2 Canada
- 8.3 Europe
- 8.3.1 Germany
- 8.3.2 UK
- 8.3.3 France
- 8.3.4 Spain
- 8.3.5 Italy
- 8.3.6 Netherlands
- 8.4 Asia Pacific
- 8.4.1 China
- 8.4.2 India
- 8.4.3 Japan
- 8.4.4 Australia
- 8.4.5 South Korea
- 8.5 Latin America
- 8.5.1 Brazil
- 8.5.2 Mexico
- 8.5.3 Argentina
- 8.6 Middle East and Africa
- 8.6.1 South Africa
- 8.6.2 Saudi Arabia
- 8.6.3 UAE
Chapter 9 Company Profiles
- 9.1 Alltech
- 9.2 Bentoii
- 9.3 Boehringer Ingelheim
- 9.4 Cargill
- 9.5 Ceva
- 9.6 Chanelle Pharma
- 9.7 Dechra Pharmaceuticals
- 9.8 Equal pharma
- 9.9 Esaote
- 9.10 Hallmarq Veterinary
- 9.11 Heska Corporation
- 9.12 IDEXX Laboratories
- 9.13 Intacin
- 9.14 Merck
- 9.15 Vetoquinol
- 9.16 Zoetis

