
PUBLISHER: Global Market Insights Inc. | PRODUCT CODE: 1666916

PUBLISHER: Global Market Insights Inc. | PRODUCT CODE: 1666916
Ceramic Matrix Composites Market Opportunity, Growth Drivers, Industry Trend Analysis, and Forecast 2025 - 2034
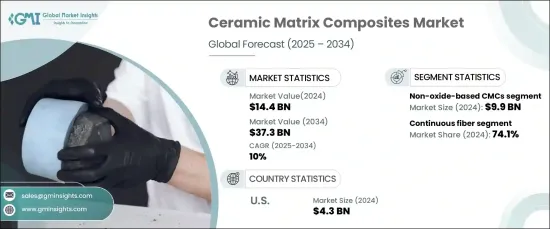
The Global Ceramic Matrix Composites Market is experiencing robust growth, reaching USD 14.4 billion in 2024, with projections to expand at a CAGR of 10% from 2025 to 2034. Ceramic matrix composites are revolutionizing industries due to their exceptional strength-to-weight ratio, superior high-temperature tolerance, and unparalleled durability. These advanced materials are indispensable in applications where performance under extreme conditions is paramount, including aerospace, defense, and energy sectors. The increasing emphasis on lightweight, high-strength alternatives to traditional metals and alloys has positioned CMCs as a critical component in the quest for greater fuel efficiency and reduced carbon emissions. Their growing adoption across a diverse range of applications underscores their importance in modern engineering and technology.
The aerospace and defense industries are at the forefront of CMC demand, relying on these materials for high-performance components such as turbine blades, exhaust systems, and structural reinforcements for aircraft and spacecraft. As global efforts to enhance fuel efficiency and achieve sustainability targets intensify, the unique properties of CMCs have made them an essential material choice. Their ability to significantly reduce weight while maintaining superior mechanical strength and thermal resistance ensures they meet the stringent requirements of cutting-edge aviation and space technologies.
| Market Scope | |
|---|---|
| Start Year | 2024 |
| Forecast Year | 2025-2034 |
| Start Value | $14.4 Billion |
| Forecast Value | $37.3 Billion |
| CAGR | 10% |
In terms of matrix materials, the CMC market is divided into oxide-based and non-oxide-based composites. Non-oxide-based CMCs dominate the market, generating USD 9.9 billion in revenue in 2024. These composites, predominantly comprising silicon carbide (SiC) and carbon, are celebrated for their remarkable mechanical intensity, thermal resistivity, and wear properties. These attributes make them particularly valuable in industries such as aerospace, automotive, and energy, where materials must endure extreme conditions without compromising performance.
The market segmentation by fiber type reveals a strong preference for continuous fiber-reinforced ceramic matrix composites (CF-CMCs), which account for 74.1% of the market share. CF-CMCs are highly sought after due to their superior strength, thermal stability, and damage tolerance. By embedding continuous fibers, either ceramic or carbon, within the ceramic matrix, these composites deliver unmatched resistance to thermal shocks and mechanical stresses. This resilience positions CF-CMCs as the material of choice for high-performance applications, including advanced propulsion systems and structural components in critical industries.
The U.S. leads the North American ceramic matrix composites market, generating USD 4.3 billion in revenue in 2024. The country's dominance stems from its robust aerospace and defense sectors, substantial R&D investments, and the presence of major manufacturers. The increasing demand for lightweight, high-strength materials across industries like aviation and energy ensures that the U.S. market remains at the forefront of innovation and adoption in CMC technology.
Table of Contents
Chapter 1 Methodology & Scope
- 1.1 Market scope & definition
- 1.2 Base estimates & calculations
- 1.3 Forecast calculation
- 1.4 Data sources
- 1.4.1 Primary
- 1.4.2 Secondary
- 1.4.2.1 Paid sources
- 1.4.2.2 Public sources
Chapter 2 Executive Summary
- 2.1 Industry synopsis, 2021-2034
Chapter 3 Industry Insights
- 3.1 Industry ecosystem analysis
- 3.1.1 Factor affecting the value chain
- 3.1.2 Profit margin analysis
- 3.1.3 Disruptions
- 3.1.4 Future outlook
- 3.1.5 Manufacturers
- 3.1.6 Distributors
- 3.2 Supplier landscape
- 3.3 Profit margin analysis
- 3.4 Key news & initiatives
- 3.5 Regulatory landscape
- 3.6 Impact forces
- 3.6.1 Growth drivers
- 3.6.1.1 High demand in aerospace and defense
- 3.6.1.2 Rising focus on lightweight automotive components
- 3.6.1.3 Growth in renewable energy applications
- 3.6.2 Industry pitfalls & challenges
- 3.6.2.1 High production and material costs
- 3.6.2.2 Competition from alternative composite materials
- 3.6.1 Growth drivers
- 3.7 Growth potential analysis
- 3.8 Porter’s analysis
- 3.9 PESTEL analysis
Chapter 4 Competitive Landscape, 2024
- 4.1 Introduction
- 4.2 Company market share analysis
- 4.3 Competitive positioning matrix
- 4.4 Strategic outlook matrix
Chapter 5 Market Size and Forecast, By Matrix Material, 2021-2034 (USD Billion) (Kilo Tons)
- 5.1 Key trends
- 5.2 Oxide-based CMCs
- 5.3 Non-oxide-based CMCs
Chapter 6 Market Size and Forecast, By Fiber Type, 2021-2034 (USD Billion) (Kilo Tons)
- 6.1 Key trends
- 6.2 continuous fiber
- 6.3 Discontinuous/SiC whisker
Chapter 7 Market Size and Forecast, By End Use, 2021-2034 (USD Billion) (Kilo Tons)
- 7.1 Key trends
- 7.2 Aerospace & defense
- 7.3 Automotive
- 7.4 Energy & power
- 7.5 Industrial
- 7.6 Others
Chapter 8 Market Size and Forecast, By Region, 2021-2034 (USD Billion) (Kilo Tons)
- 8.1 Key trends
- 8.2 North America
- 8.2.1 U.S.
- 8.2.2 Canada
- 8.3 Europe
- 8.3.1 UK
- 8.3.2 Germany
- 8.3.3 France
- 8.3.4 Italy
- 8.3.5 Spain
- 8.3.6 Russia
- 8.4 Asia Pacific
- 8.4.1 China
- 8.4.2 India
- 8.4.3 Japan
- 8.4.4 South Korea
- 8.4.5 Australia
- 8.5 Latin America
- 8.5.1 Brazil
- 8.5.2 Mexico
- 8.6 MEA
- 8.6.1 South Africa
- 8.6.2 Saudi Arabia
- 8.6.3 UAE
Chapter 9 Company Profiles
- 9.1 Applied Thin Films, Inc.
- 9.2 CeramTec GmbH
- 9.3 COI Ceramics, Inc.
- 9.4 CoorsTek, Inc.
- 9.5 General Electric Company
- 9.6 Kyocera Corporation
- 9.7 Lancer Systems
- 9.8 Morgan Advanced Materials
- 9.9 Reinhold Industries, Inc.
- 9.10 Renegade Materials Corporation
- 9.11 Rolls-Royce plc

