
PUBLISHER: Global Market Insights Inc. | PRODUCT CODE: 1892848

PUBLISHER: Global Market Insights Inc. | PRODUCT CODE: 1892848
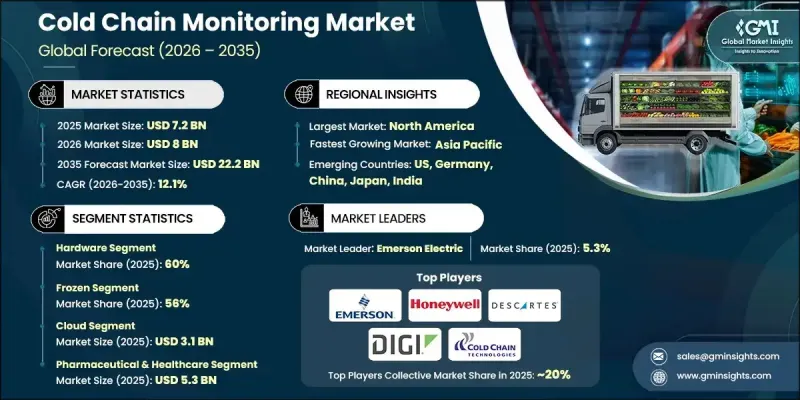
Cold Chain Monitoring Market Opportunity, Growth Drivers, Industry Trend Analysis, and Forecast 2026 - 2035
The Global Cold Chain Monitoring Market was valued at USD 7.2 billion in 2025 and is estimated to grow at a CAGR of 12.1% to reach USD 22.2 billion by 2035.
Rising consumption of perishable foods, including fresh produce, meat, seafood, dairy, frozen meals, and ready-to-eat items, has intensified the demand for precise temperature control throughout supply chains. As delivery cycles become shorter and distribution networks broaden, companies face growing pressure to prevent product damage and maintain quality. Every shipment now requires complete traceability and strict temperature adherence, especially as global trade in perishables expands. Cold-chain monitoring has become essential for reducing waste and preserving freshness while meeting heightened expectations for safety and consistency. The need for accurate temperature oversight is even more critical in the pharmaceutical sector, where biologics, vaccines, and specialized therapies depend on tightly regulated temperature ranges. With the increasing adoption of temperature-sensitive treatments, manufacturers and distributors rely heavily on real-time, validated monitoring tools that offer alerts and audit-ready data. The accelerated deployment of digital systems during public health emergencies has further cemented real-time cold-chain oversight as a priority within the pharmaceutical landscape.
| Market Scope | |
|---|---|
| Start Year | 2025 |
| Forecast Year | 2026-2035 |
| Start Value | $7.2 Billion |
| Forecast Value | $22.2 Billion |
| CAGR | 12.1% |
The hardware segment held a 60% share in 2025 and is expected to grow at a CAGR of 12.4% from 2026 to 2035. Cold-chain operations depend on large quantities of physical monitoring devices, temperature probes, GPS units, data loggers, humidity sensors, telematics tools, and door-status detectors installed across warehouses, refrigerated transport, containers, and last-mile equipment. Because every pallet, shipment, and storage point requires continuous tracking, hardware demand grows faster than software adoption, ensuring its leading market position.
The frozen segment accounted for a 56% share in 2025 and is projected to grow at a 12.4% CAGR through 2035. Products stored at frozen temperatures, including certain pharmaceuticals, biologics, and temperature-sensitive foods, must remain within tightly controlled environments. Even the smallest deviation can compromise safety or effectiveness, prompting companies to invest in continuous monitoring, high-accuracy sensors, and reliable real-time reporting throughout the supply chain.
U.S. Cold Chain Monitoring Market generated USD 2.3 billion in 2025. The country's extensive network of refrigerated storage facilities and temperature-controlled transportation promotes strong adoption of monitoring systems. The scale of perishable food distribution, alongside strict requirements for fresh produce, packaged foods, frozen items, biologics, and advanced pharmaceuticals, reinforces the need for real-time visibility. High product variety, long transport distances, and retailer performance standards consistently elevate demand for accurate cold-chain tracking technologies.
Companies active in the Global Cold Chain Monitoring Market include Testo, Controlant, Cold Chain Technologies, Digi International, Sensitech, Zebra Technologies, Descartes Systems, Emerson Electric, Honeywell International, and ORBCOMM. Companies competing in the Cold Chain Monitoring Market strengthen their position by expanding hardware portfolios, enhancing sensor accuracy, and integrating advanced connectivity features into their product lines. Many firms focus on developing real-time platforms that combine temperature tracking, geolocation, and automated alerts to support regulatory compliance and reduce spoilage risk. Strategic collaborations with logistics providers and pharmaceutical manufacturers help vendors embed monitoring solutions deeper within supply chains.
Table of Contents
Chapter 1 Methodology & Scope
- 1.1 Market scope and definition
- 1.2 Research design
- 1.2.1 Research approach
- 1.2.2 Data collection methods
- 1.3 Data mining sources
- 1.3.1 Global
- 1.3.2 Regional/Country
- 1.4 Base estimates and calculations
- 1.4.1 Base year calculation
- 1.4.2 Key trends for market estimation
- 1.5 Primary research and validation
- 1.5.1 Primary sources
- 1.6 Forecast
- 1.7 Research assumptions and limitations
Chapter 2 Executive Summary
- 2.1 Industry 360° synopsis
- 2.2 Key market trends
- 2.2.1 Regional
- 2.2.2 Component
- 2.2.3 Temperature
- 2.2.4 Deployment
- 2.2.5 Logistics
- 2.2.6 End use
- 2.3 TAM Analysis, 2026-2035
- 2.4 CXO perspectives: Strategic imperatives
- 2.4.1 Key decision points for industry executives
- 2.4.2 Critical success factors for market players
- 2.5 Future outlook and strategic recommendations
Chapter 3 Industry Insights
- 3.1 Industry ecosystem analysis
- 3.1.1 Supplier landscape
- 3.1.1.1 Sensor & hardware manufacturers
- 3.1.1.2 Connectivity & IoT network providers
- 3.1.1.3 Software / platform providers
- 3.1.1.4 Cold chain packaging & insulated containers
- 3.1.1.5 Refrigeration equipment manufacturers
- 3.1.1.6 Cold storage operators & warehouse infrastructure
- 3.1.2 Cost structure
- 3.1.3 Profit margin
- 3.1.4 Value addition at each stage
- 3.1.5 Factors impacting the supply chain
- 3.1.6 Disruptors
- 3.1.1 Supplier landscape
- 3.2 Impact on forces
- 3.2.1 Growth drivers
- 3.2.1.1 Rapid growth of cloud computing & hyperscale expansion
- 3.2.1.2 Explosion of AI, machine learning & high-performance computing (HPC)
- 3.2.1.3 Increasing data generation across industries
- 3.2.1.4 Growth of edge computing for low-latency applications
- 3.2.2 Industry pitfalls & challenges
- 3.2.2.1 Power & cooling constraints limit high-density server deployments
- 3.2.2.2 Rising energy costs pressure TCO and server refresh decisions
- 3.2.2.3 Supply chain volatility and semiconductor shortages delay server shipments
- 3.2.3 Market opportunities
- 3.2.3.1 Accelerated adoption of AI-optimized and GPU-accelerated servers
- 3.2.3.2 Growth of edge computing opens new server deployment footprints
- 3.2.3.3 Transition to liquid cooling creates hardware upgrade cycles
- 3.2.3.4 Rise of ARM-based servers and alternative architectures
- 3.2.1 Growth drivers
- 3.3 Growth potential analysis
- 3.4 Regulatory landscape
- 3.4.1 North America
- 3.4.2 Europe
- 3.4.3 Asia Pacific
- 3.4.4 Latin America
- 3.4.5 Middle East & Africa
- 3.5 Porter's analysis
- 3.6 PESTEL analysis
- 3.7 Technology trends & innovation ecosystem
- 3.7.1 Current technologies
- 3.7.1.1 IoT-based sensors & wireless environmental sensors
- 3.7.1.2 Temperature & humidity data loggers
- 3.7.1.3 Telematics integration for refrigerated containers / vehicles
- 3.7.1.4 GPS / location tracking combined with monitoring for refrigerated containers
- 3.7.2 Emerging technologies
- 3.7.2.1 Predictive analytics / AI and ML-driven analytics
- 3.7.2.2 Data-driven decision-making platforms
- 3.7.2.3 Integration with broader supply-chain systems
- 3.7.2.4 Edge computing / local processing & hybrid architectures
- 3.7.1 Current technologies
- 3.8 Patent analysis
- 3.9 Price trend analysis
- 3.9.1 By region
- 3.9.2 By products
- 3.10 Production statistics
- 3.10.1 Production hubs
- 3.10.2 Consumption hubs
- 3.10.3 Export and import
- 3.11 Cost breakdown analysis
- 3.12 Risk analysis & management
- 3.12.1 Operational risk assessment
- 3.12.2 Financial risk evaluation
- 3.12.3 Technology & cybersecurity risks
- 3.12.4 Risk mitigation strategies
- 3.13 Sustainability and environmental aspects
- 3.13.1 Sustainable practices
- 3.13.2 Waste reduction strategies
- 3.13.3 Energy efficiency in production
- 3.13.4 Eco-friendly initiatives
- 3.13.5 Carbon footprint considerations
- 3.14 Use cases
- 3.15 Best case scenario
- 3.16 ROI & Cost-Benefit Analysis
- 3.17 Feature & pricing benchmarking
- 3.18 Customer preference / buying behavior
Chapter 4 Competitive Landscape, 2025
- 4.1 Introduction
- 4.2 Company market share analysis
- 4.2.1 North America
- 4.2.2 Europe
- 4.2.3 Asia Pacific
- 4.2.4 LATAM
- 4.2.5 MEA
- 4.3 Competitive analysis of major market players
- 4.4 Competitive positioning matrix
- 4.5 Strategic outlook matrix
- 4.6 Key developments
- 4.6.1 Mergers & acquisitions
- 4.6.2 Partnerships & collaborations
- 4.6.3 New product launches
- 4.6.4 Expansion plans and funding
Chapter 5 Market Estimates & Forecast, By Component, 2022 - 2035 ($Bn, Units)
- 5.1 Key trends
- 5.2 Hardware
- 5.2.1 Sensors
- 5.2.2 RFID devices
- 5.2.3 Telematics
- 5.2.4 Networking devices
- 5.2.5 Others
- 5.3 Software
- 5.3.1 Real-time monitoring
- 5.3.2 Analytics and reporting
- 5.4 Services
- 5.4.1 Professional services
- 5.4.2 Managed services
Chapter 6 Market Estimates & Forecast, By Temperature, 2022 - 2035 ($Bn, Units)
- 6.1 Key trends
- 6.2 Frozen
- 6.3 Chilled
Chapter 7 Market Estimates & Forecast, By Deployment, 2022 - 2035 ($Bn, Units)
- 7.1 Key trends
- 7.2 Cloud
- 7.3 On-premises
- 7.4 Hybrid
Chapter 8 Market Estimates & Forecast, By Logistics, 2022 - 2035 ($Bn, Units)
- 8.1 Key trends
- 8.2 Storage
- 8.3 Transportation
Chapter 9 Market Estimates & Forecast, By End Use, 2022 - 2035 ($Bn, Units)
- 9.1 Key trends
- 9.2 Pharmaceutical & healthcare
- 9.3 Food & beverage
- 9.4 Logistics & distribution
- 9.5 Chemical
- 9.6 Others
Chapter 10 Market Estimates & Forecast, By Region, 2022 - 2035 ($Bn, Units)
- 10.1 Key trends
- 10.2 North America
- 10.2.1 US
- 10.2.2 Canada
- 10.3 Europe
- 10.3.1 Germany
- 10.3.2 UK
- 10.3.3 France
- 10.3.4 Italy
- 10.3.5 Spain
- 10.3.6 Russia
- 10.3.7 Nordics
- 10.3.8 Benelux
- 10.4 Asia Pacific
- 10.4.1 China
- 10.4.2 India
- 10.4.3 Japan
- 10.4.4 Australia
- 10.4.5 South Korea
- 10.4.6 Thailand
- 10.4.7 Indonesia
- 10.4.8 Singapore
- 10.5 Latin America
- 10.5.1 Brazil
- 10.5.2 Mexico
- 10.5.3 Argentina
- 10.5.4 Colombia
- 10.6 MEA
- 10.6.1 South Africa
- 10.6.2 Saudi Arabia
- 10.6.3 UAE
Chapter 11 Company Profiles
- 11.1 Global Leaders
- 11.1.1 Sensitech (Carrier Global)
- 11.1.2 Emerson Electric
- 11.1.3 Honeywell International
- 11.1.4 Descartes Systems
- 11.1.5 Digi International
- 11.1.6 Zebra Technologies
- 11.1.7 Cold Chain Technologies (CCT)
- 11.1.8 ORBCOMM
- 11.1.9 Controlant
- 11.1.10 Testo
- 11.1.11 ELPRO-Buchs
- 11.2 Regional Champions
- 11.2.1 DeltaTrak
- 11.2.2 Monnit
- 11.2.3 FreshLoc Technologies
- 11.2.4 Samsara
- 11.2.5 Tive
- 11.2.6 Roambee
- 11.2.7 Blulog (low-power NFC and wireless data loggers)
- 11.2.8 OnAsset Intelligence (air cargo temperature & security tracking)
- 11.2.9 Zest Labs
- 11.2.10 TagBox
- 11.3 Emerging Players
- 11.3.1 SenseAnywhere
- 11.3.2 Rotronic
- 11.3.3 TempGenius
- 11.3.4 Zhuhai Rayonics Technology
- 11.3.5 Blulog

