
PUBLISHER: Global Market Insights Inc. | PRODUCT CODE: 1684833

PUBLISHER: Global Market Insights Inc. | PRODUCT CODE: 1684833
Vapor Barriers Market Opportunity, Growth Drivers, Industry Trend Analysis, and Forecast 2025 - 2034
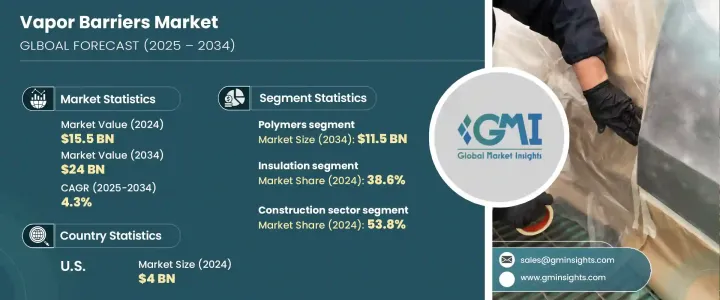
The Global Vapor Barriers Market reached USD 15.5 billion in 2024 and is projected to expand at a CAGR of 4.3% between 2025 and 2034. This upward trajectory is fueled by the increasing focus on energy-efficient construction, sustainability, and advanced building technologies. As industries and homeowners prioritize moisture control, energy conservation, and indoor air quality, the demand for vapor barriers continues to surge across residential, commercial, and industrial applications. The adoption of these barriers is further reinforced by stringent building codes, especially in regions with extreme climates, where protection against moisture infiltration is crucial for maintaining structural integrity and preventing mold-related health hazards.
Rapid urbanization and industrialization are also key drivers propelling the market forward. As more construction projects incorporate advanced insulation solutions, the role of vapor barriers in preventing heat loss and moisture accumulation has become even more essential. Additionally, the increasing prevalence of green building initiatives is encouraging the use of high-performance materials that enhance energy efficiency. Government incentives and rebates aimed at promoting eco-friendly construction practices further contribute to market expansion, making vapor barriers an integral component of modern building design. Technological advancements in barrier materials, including nanotechnology and self-healing coatings, are expected to improve product efficiency, fostering further growth over the next decade.
| Market Scope | |
|---|---|
| Start Year | 2024 |
| Forecast Year | 2025-2034 |
| Start Value | $15.5 Billion |
| Forecast Value | $24 Billion |
| CAGR | 4.3% |
The market is categorized by material type, including polymers, glass, metal, drywall, and others. Polymers dominate the segment, generating USD 7.6 billion in 2024, and is projected to reach USD 11.5 billion by 2034. Their widespread preference stems from their cost-effectiveness, durability, and superior moisture resistance. Polyethylene and polypropylene, in particular, are popular choices due to their flexibility, ease of installation, and long-term performance. These materials also offer enhanced resistance to environmental factors such as UV exposure, ensuring extended lifespan and reliability in various construction applications.
By application, the market is segmented into waterproofing, corrosion resistance, insulation, and others. The insulation segment accounts for 38.6% of the market share in 2024, reflecting its critical role in optimizing energy efficiency and controlling moisture. Integrated vapor barriers in insulation materials help maintain stable indoor temperatures, reduce energy consumption, and prevent mold-related issues, particularly in regions with extreme weather conditions. The growing demand for sustainable and high-performance insulation solutions continues to drive this segment's growth as builders and property owners seek materials that enhance thermal efficiency while meeting evolving regulatory requirements.
The U.S. vapor barriers market, valued at USD 4 billion in 2024, remains a frontrunner due to the growing adoption of energy-efficient and sustainable construction solutions. Increased awareness of moisture control and its impact on insulation and energy savings continues to fuel demand. Additionally, strict regulations from organizations such as the International Energy Conservation Code (IECC) and ASHRAE are driving the widespread use of vapor barriers in residential and commercial construction projects. As builders and developers prioritize long-term durability, energy efficiency, and compliance with evolving building standards, the demand for vapor barriers is expected to remain strong in the coming years.
Table of Contents
Chapter 1 Methodology & Scope
- 1.1 Market scope & definition
- 1.2 Base estimates & calculations
- 1.3 Forecast calculation
- 1.4 Data sources
- 1.4.1 Primary
- 1.4.2 Secondary
- 1.4.2.1 Paid sources
- 1.4.2.2 Public sources
Chapter 2 Executive Summary
- 2.1 Industry synopsis, 2021-2034
Chapter 3 Industry Insights
- 3.1 Industry ecosystem analysis
- 3.1.1 Factor affecting the value chain
- 3.1.2 Profit margin analysis
- 3.1.3 Disruptions
- 3.1.4 Future outlook
- 3.1.5 Manufacturers
- 3.1.6 Distributors
- 3.2 Supplier landscape
- 3.3 Profit margin analysis
- 3.4 Key news & initiatives
- 3.5 Regulatory landscape
- 3.6 Impact forces
- 3.6.1 Growth drivers
- 3.6.1.1 Increasing awareness of energy conservation and sustainable building
- 3.6.1.2 Government regulations on energy efficiency and moisture control in construction projects
- 3.6.1.3 Green building certifications (e.g., LEED) are encouraging the adoption of materials like vapor barriers to meet environmental standards.
- 3.6.2 Industry pitfalls & challenges
- 3.6.2.1 Vapor barriers must be carefully selected for compatibility with various construction materials
- 3.6.2.2 The initial cost of installing vapor barriers can be high, especially for high-quality materials.
- 3.6.1 Growth drivers
- 3.7 Growth potential analysis
- 3.8 Porter’s analysis
- 3.9 PESTEL analysis
Chapter 4 Competitive Landscape, 2024
- 4.1 Introduction
- 4.2 Company market share analysis
- 4.3 Competitive positioning matrix
- 4.4 Strategic outlook matrix
Chapter 5 Market Size and Forecast, By Material, 2021-2034 (USD Billion) (SqM)
- 5.1 Key trends
- 5.2 Polymers
- 5.2.1 Polyethylene
- 5.2.2 Polypropylene
- 5.2.3 Polyvinyl chloride
- 5.2.4 Others
- 5.3 Glass
- 5.4 Metal
- 5.5 Drywall
- 5.6 Others
Chapter 6 Market Size and Forecast, By Application, 2021-2034 (USD Billion) (SqM)
- 6.1 Key trends
- 6.2 Insulation
- 6.3 Waterproofing
- 6.4 Corrosion resistance
- 6.5 Others
Chapter 7 Market Size and Forecast, By Installation, 2021-2034 (USD Billion) (SqM)
- 7.1 Key trends
- 7.2 Membranes
- 7.3 Coatings
- 7.4 Cementitious waterproofing
- 7.5 Stacking and filling
Chapter 8 Market Size and Forecast, By End Use, 2021-2034 (USD Billion) (SqM)
- 8.1 Key trends
- 8.2 Construction
- 8.3 Packaging
- 8.4 Automotive
- 8.5 Others
Chapter 9 Market Size and Forecast, By Region, 2021-2034 (USD Billion) (SqM)
- 9.1 Key trends
- 9.2 North America
- 9.2.1 U.S.
- 9.2.2 Canada
- 9.3 Europe
- 9.3.1 UK
- 9.3.2 Germany
- 9.3.3 France
- 9.3.4 Italy
- 9.3.5 Spain
- 9.3.6 Russia
- 9.4 Asia Pacific
- 9.4.1 China
- 9.4.2 India
- 9.4.3 Japan
- 9.4.4 South Korea
- 9.4.5 Australia
- 9.5 Latin America
- 9.5.1 Brazil
- 9.5.2 Mexico
- 9.6 MEA
- 9.6.1 South Africa
- 9.6.2 Saudi Arabia
- 9.6.3 UAE
Chapter 10 Company Profiles
- 10.1 BASF
- 10.2 Carlisle Companies
- 10.3 CertainTeed Corporation
- 10.4 Dow Chemical Company
- 10.5 DuPont de Nemours
- 10.6 Firestone Building Products
- 10.7 GAF Materials Corporation
- 10.8 GCP Applied Technologies
- 10.9 Honeywell
- 10.10 Johns Manville
- 10.11 Sika
- 10.12 Soprema Group

