
PUBLISHER: Global Market Insights Inc. | PRODUCT CODE: 1666655

PUBLISHER: Global Market Insights Inc. | PRODUCT CODE: 1666655
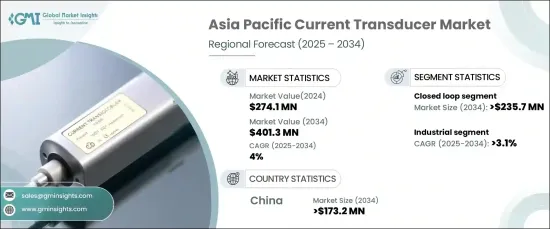
Asia Pacific Current Transducer Market Opportunity, Growth Drivers, Industry Trend Analysis, and Forecast 2025 - 2034
Asia Pacific Current Transducer Market, with its valuation at USD 274.1 million in 2024, is projected to depict a CAGR of 4% from 2025 to 2034. This robust expansion is driven by technological advancements, surging industrial automation, and the rising demand for precise electrical monitoring across diverse sectors. Rapid industrialization in countries like China, India, and those in Southeast Asia is a crucial factor contributing to this upward trajectory. These regions are experiencing a wave of infrastructure development, intensifying the need for efficient power monitoring systems. Industries such as manufacturing, power generation, and utilities are increasingly relying on current transducers to enhance energy efficiency, minimize operational costs, and maintain electrical system stability. Moreover, the growing adoption of Industry 4.0 practices has amplified the demand for advanced electrical monitoring devices, ensuring streamlined operations and enhanced productivity.
Another significant factor driving the market is the ongoing integration of renewable energy sources into regional power grids. Countries like China and India are at the forefront of this energy transition, focusing on solar, wind, and other renewable solutions. Current transducers play a pivotal role in this shift by enabling accurate monitoring and control of electricity flow from renewable sources. Their ability to optimize energy generation and ensure grid stability makes them indispensable in the modernization of the energy sector. With governments across the Asia Pacific prioritizing cleaner energy solutions, the demand for high-precision monitoring devices continues to rise.
| Market Scope | |
|---|---|
| Start Year | 2024 |
| Forecast Year | 2025-2034 |
| Start Value | $274.1 Million |
| Forecast Value | $401.3 Million |
| CAGR | 4% |
The closed-loop segment of the current transducer market is set to exceed USD 235.7 million by 2034, propelled by the demand for reliable and accurate electrical monitoring solutions. These devices are crucial for applications requiring precision in automation, power management, and renewable energy systems. Their ability to provide constant feedback for operational adjustments enhances equipment protection and ensures optimal efficiency. Industries increasingly rely on closed-loop transducers for their unmatched precision and reliability, cementing their position as a vital component in modern electrical systems.
In the industrial sector, the market is expected to grow at a CAGR of over 3.1% through 2034. Industrial automation has become a key trend across the region, with businesses prioritizing operational optimization, energy efficiency, and minimized downtime. Current transducers, integral to industrial automation, provide real-time data on electrical currents, enabling automatic adjustments, safeguarding equipment, and maintaining process efficiency. Sectors such as automotive, manufacturing, and electronics are particularly benefiting from these advancements, further fueling market demand.
China is leading the charge in the Asia Pacific current transducer market, projected to surpass USD 173.2 million by 2034. As the country continues to expand its manufacturing and industrial sectors, the necessity for precise monitoring and control of electrical systems has intensified. Current transducers, essential for delivering real-time data on electrical currents, enable industries to enhance operations, cut energy consumption, and protect equipment from faults or overloads. The increasing implementation of automation in Chinese factories, coupled with the government's push for Industry 4.0 initiatives, is driving substantial demand for current transducers in industrial applications.
Table of Contents
Chapter 1 Methodology & Scope
- 1.1 Market definitions
- 1.2 Base estimates & calculations
- 1.3 Forecast calculation
- 1.4 Data sources
- 1.4.1 Primary
- 1.4.2 Secondary
- 1.4.2.1 Paid
- 1.4.2.2 Public
Chapter 2 Industry Insights
- 2.1 Industry ecosystem analysis
- 2.2 Regulatory landscape
- 2.3 Industry impact forces
- 2.3.1 Growth drivers
- 2.3.2 Industry pitfalls & challenges
- 2.4 Growth potential analysis
- 2.5 Porter's analysis
- 2.5.1 Bargaining power of suppliers
- 2.5.2 Bargaining power of buyers
- 2.5.3 Threat of new entrants
- 2.5.4 Threat of substitutes
- 2.6 PESTEL analysis
Chapter 3 Competitive landscape, 2024
- 3.1 Strategic dashboard
- 3.2 Innovation & sustainability landscape
Chapter 4 Market Size and Forecast, By Technology, 2021 – 2034 (USD Million)
- 4.1 Key trends
- 4.2 Closed loop
- 4.3 Open loop
Chapter 5 Market Size and Forecast, By Application, 2021 – 2034 (USD Million)
- 5.1 Key trends
- 5.2 Motor drive
- 5.3 Converter & inverter
- 5.4 Battery management
- 5.5 UPS & SMPS
- 5.6 Others
Chapter 6 Market Size and Forecast, By End Use, 2021 – 2034 (USD Million)
- 6.1 Key trends
- 6.2 Industrial
- 6.3 Utility
- 6.4 Automotive
- 6.5 Others
Chapter 7 Market Size and Forecast, By Region, 2021 – 2034 (USD Million)
- 7.1 Key trends
- 7.2 China
- 7.3 Japan
- 7.4 South Korea
- 7.5 India
- 7.6 Australia
Chapter 8 Company Profiles
- 8.1 ABB
- 8.2 Howard Butler
- 8.3 Johnson Controls
- 8.4 NK Technologies
- 8.5 OMRON Corporation
- 8.6 Phoenix Contact
- 8.7 Siemens
- 8.8 Texas Instruments Incorporated
- 8.9 Topstek
- 8.10 Yokogawa Electric Corporation

