
PUBLISHER: Global Market Insights Inc. | PRODUCT CODE: 1685057

PUBLISHER: Global Market Insights Inc. | PRODUCT CODE: 1685057
Fillings and Toppings Market Opportunity, Growth Drivers, Industry Trend Analysis, and Forecast 2025 - 2034
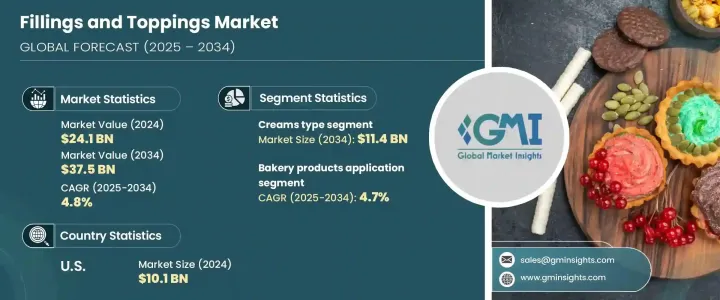
The Global Fillings And Toppings Market was valued at USD 24.1 billion in 2024 and is projected to experience a CAGR of 4.8% from 2025 to 2034. As consumers continue to seek out new, indulgent flavors, food manufacturers are responding by introducing a broad spectrum of fillings and toppings, ranging from fruits and chocolates to nuts. This growing diversity in product offerings allows companies to create unique and appealing food items that captivate consumers looking for fresh, flavorful experiences.
The market is also benefiting from increasing consumer interest in premium, artisanal products, particularly within the bakery and confectionery sectors, as people demand higher quality and distinctive flavors. Additionally, the expanding popularity of online grocery shopping and e-commerce platforms has simplified access to a variety of fillings and toppings, further fueling demand. Manufacturers are prioritizing innovation to meet the evolving preferences of modern consumers, with a clear focus on clean-label formulations and sustainable packaging.
| Market Scope | |
|---|---|
| Start Year | 2024 |
| Forecast Year | 2025-2034 |
| Start Value | $24.1 Billion |
| Forecast Value | $37.5 Billion |
| CAGR | 4.8% |
Among the many product categories, the creams segment is expected to generate USD 11.4 billion in 2024, and this number is projected to grow at a 4.5% CAGR through 2034. Creams are favored for their smooth texture and versatility, making them a popular choice in a wide array of food applications, from desserts and cakes to pastries. Available in dairy, non-dairy, and whipped varieties, creams cater to a broad range of consumer preferences, further solidifying their dominant position in the market.
In terms of application, the bakery products sector holds the largest share, accounting for 43.5% of the market in 2024, valued at USD 10.5 billion. This segment is expected to grow at a 4.7% CAGR from 2025 to 2034. Bakery items such as cakes, pastries, and bread frequently feature creams, fruit-based fillings, and pastes, driving significant demand in the fillings and toppings market. The rising preference for indulgent yet convenient food options, combined with an increasing desire for customizable and premium bakery products, is contributing to this market growth.
In the U.S., the fillings and toppings market is forecasted to reach USD 10.1 billion by 2034, with a CAGR of 4.5% from 2025 to 2034. This growth is fueled by shifting consumer preferences toward convenience and customization in food. Particularly in the bakery, confectionery, and dairy industries, the demand for premium fillings and toppings is increasing as consumers are more inclined to invest in high-quality, unique products. Creams continue to dominate in this region due to their versatility and widespread use in various desserts, baked goods, and pastries.
Table of Contents
Chapter 1 Methodology & Scope
- 1.1 Market scope & definition
- 1.2 Base estimates & calculations
- 1.3 Forecast calculation
- 1.4 Data sources
- 1.4.1 Primary
- 1.4.2 Secondary
- 1.4.2.1 Paid sources
- 1.4.2.2 Public sources
Chapter 2 Executive Summary
- 2.1 Industry synopsis, 2021-2034
Chapter 3 Industry Insights
- 3.1 Industry ecosystem analysis
- 3.1.1 Factor affecting the value chain
- 3.1.2 Profit margin analysis
- 3.1.3 Disruptions
- 3.1.4 Future outlook
- 3.1.5 Manufacturers
- 3.1.6 Distributors
- 3.2 Supplier landscape
- 3.3 Profit margin analysis
- 3.4 Key news & initiatives
- 3.5 Regulatory landscape
- 3.6 Impact forces
- 3.7 Industry impact forces
- 3.7.1 Growth drivers
- 3.7.1.1 Increasing demand for processed foods and snacks
- 3.7.1.2 Growing popularity of premium and functional food products
- 3.7.1.3 Expanding food and beverage industry
- 3.7.2 Market challenges
- 3.7.2.1 Health concerns
- 3.7.1 Growth drivers
- 3.8 Regulations & market impact
- 3.9 Porter’s analysis
- 3.10 PESTEL analysis
Chapter 4 Competitive Landscape, 2024
- 4.1 Introduction
- 4.2 Company market share analysis
- 4.3 Competitive positioning matrix
- 4.4 Strategic outlook matrix
Chapter 5 Market Size and Forecast, By Type, 2021-2034 (USD Billion) (kilo Tons)
- 5.1 Key trends
- 5.2 Creams
- 5.3 Fruits and nuts
- 5.4 Fondants
- 5.5 Sprinkles
- 5.6 Syrups
- 5.7 Pastes and variegates
Chapter 6 Market Size and Forecast, By Flavor, 2021-2034 (USD Billion) (kilo Tons)
- 6.1 Key trends
- 6.2 Fruits
- 6.3 Chocolates
- 6.4 Vanilla
- 6.5 Spices
- 6.6 Nuts
Chapter 7 Market Size and Forecast, By Application, 2021-2034 (USD Billion) (kilo Tons)
- 7.1 Key trends
- 7.2 Bakery products
- 7.3 Confectionery products
- 7.4 Dairy products
- 7.5 Frozen products
Chapter 8 Market Size and Forecast, By Raw Material, 2021-2034 (USD Billion) (kilo Tons)
- 8.1 Key trends
- 8.2 Fruits
- 8.3 Starch
- 8.4 Hydrocolloid
- 8.5 Sweeteners
- 8.6 Dairy ingredients
- 8.7 Cocoa
- 8.8 Others
Chapter 9 Market Size and Forecast, By Region, 2021-2034 (USD Billion) (kilo Tons)
- 9.1 Key trends
- 9.2 North America
- 9.2.1 U.S.
- 9.2.2 Canada
- 9.3 Europe
- 9.3.1 UK
- 9.3.2 Germany
- 9.3.3 France
- 9.3.4 Italy
- 9.3.5 Spain
- 9.3.6 Russia
- 9.4 Asia Pacific
- 9.4.1 China
- 9.4.2 India
- 9.4.3 Japan
- 9.4.4 South Korea
- 9.4.5 Australia
- 9.5 Latin America
- 9.5.1 Brazil
- 9.5.2 Mexico
- 9.6 MEA
- 9.6.1 South Africa
- 9.6.2 Saudi Arabia
- 9.6.3 UAE
Chapter 10 Company Profiles
- 10.1 ADM
- 10.2 Bakkavor Group
- 10.3 Barry Callebaut
- 10.4 Cargill
- 10.5 CSM Bakery Ingredients
- 10.6 Dawn Foods
- 10.7 Fleischmann's Ingredients
- 10.8 Frutarom
- 10.9 Ikor Group
- 10.10 Ingredion
- 10.11 Kerry Group
- 10.12 Nestle
- 10.13 Puratos
- 10.14 Sensient Technologies
- 10.15 Tate & Lyle

