
PUBLISHER: Global Market Insights Inc. | PRODUCT CODE: 1667168

PUBLISHER: Global Market Insights Inc. | PRODUCT CODE: 1667168
Metal Halide Mobile Light Tower Market Opportunity, Growth Drivers, Industry Trend Analysis, and Forecast 2025 - 2034
The Global Metal Halide Mobile Light Tower Market was valued at USD 1.7 billion in 2024 and is anticipated to expand at a CAGR of 4.6% from 2025 to 2034. This growth is primarily driven by increasing demand across key industries, including construction, mining, and emergency services. These light towers are highly valued for their portability, high-intensity lighting, and adaptability, making them perfect for outdoor and remote locations where reliable illumination is essential. The market is further benefiting from advancements in technology, such as improvements in power sources, including diesel and hybrid models. Growing eco-consciousness has also led to an uptick in demand for more sustainable solutions, such as battery-powered units and solar-powered light towers.
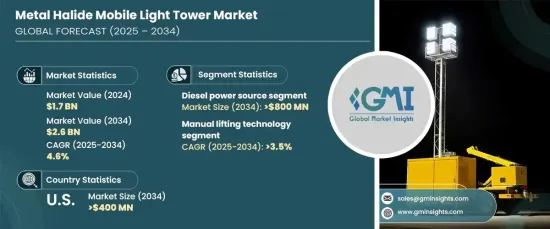
As manufacturers focus on enhancing efficiency, new innovations like automatic height adjustment, improved mobility, and smart technology integration are gaining traction. These developments are aligned with industry trends toward operational efficiency and sustainability. Diesel-powered light towers, known for their reliability in tough, off-grid environments, are projected to exceed USD 800 million by 2034, particularly in industries that require rugged, high-performance solutions. Solar-powered light towers are also becoming increasingly popular, especially in regions with abundant sunlight, as they offer an eco-friendly, cost-effective alternative to traditional fuel-powered units.
| Market Scope | |
|---|---|
| Start Year | 2024 |
| Forecast Year | 2025-2034 |
| Start Value | $1.7 Billion |
| Forecast Value | $2.6 Billion |
| CAGR | 4.6% |
The market is also witnessing growth in the manual lifting technology segment, with a projected CAGR of over 3.5% through 2034. This is largely due to the integration of automation technologies that improve operational ease and reduce labor costs. Additionally, innovations in power management, particularly hybrid systems combining diesel and solar energy, are making these towers more fuel-efficient. LED lighting technology is also playing a role in transforming the market, with manufacturers offering hybrid solutions that blend the energy-efficient properties of LED lights with the high-intensity capabilities of metal halide bulbs. These advancements are helping to shape the future of the metal halide mobile light tower market.
In the U.S., the market is expected to surpass USD 400 million by 2034, driven by the growing needs of the construction, mining, and emergency service sectors. The increasing preference for hybrid power systems, including solar and diesel combinations, is helping to reduce emissions and improve fuel efficiency. As technology evolves, features like automated height adjustments and remote monitoring are becoming more common, enhancing operational efficiency across the industry.
Table of Contents
Chapter 1 Methodology & Scope
- 1.1 Market definitions
- 1.2 Base estimates & calculations
- 1.3 Forecast calculation
- 1.4 Data sources
- 1.4.1 Primary
- 1.4.2 Secondary
- 1.4.2.1 Paid
- 1.4.2.2 Public
Chapter 2 Executive Summary
- 2.1 Industry synopsis, 2021 - 2034
Chapter 3 Industry Insights
- 3.1 Industry ecosystem analysis
- 3.2 Regulatory landscape
- 3.3 Industry impact forces
- 3.3.1 Growth drivers
- 3.3.2 Industry pitfalls & challenges
- 3.4 Growth potential analysis
- 3.5 Porter's analysis
- 3.5.1 Bargaining power of suppliers
- 3.5.2 Bargaining power of buyers
- 3.5.3 Threat of new entrants
- 3.5.4 Threat of substitutes
- 3.6 PESTEL analysis
Chapter 4 Competitive Landscape, 2024
- 4.1 Strategic dashboard
- 4.2 Innovation & sustainability landscape
Chapter 5 Market Size and Forecast, By Power Source, 2021 – 2034 (USD Million, ‘000 Units)
- 5.1 Key trends
- 5.2 Diesel
- 5.3 Solar
- 5.4 Direct
- 5.5 Others
Chapter 6 Market Size and Forecast, By Technology, 2021 – 2034 (USD Million, ‘000 Units)
- 6.1 Key trends
- 6.2 Manual lifting system
- 6.3 Hydraulic lifting system
Chapter 7 Market Size and Forecast, By Application, 2021 – 2034 (USD Million, ‘000 Units)
- 7.1 Key trends
- 7.2 Construction
- 7.3 Infrastructure development
- 7.4 Oil & gas
- 7.5 Mining
- 7.6 Military & defense
- 7.7 Emergency & disaster relief
- 7.8 Others
Chapter 8 Market Size and Forecast, By Region, 2021 – 2034 (USD Million, ‘000 Units)
- 8.1 Key trends
- 8.2 North America
- 8.2.1 U.S.
- 8.2.2 Canada
- 8.2.3 Mexico
- 8.3 Europe
- 8.3.1 Germany
- 8.3.2 UK
- 8.3.3 France
- 8.3.4 Italy
- 8.3.5 Spain
- 8.3.6 Russia
- 8.4 Asia Pacific
- 8.4.1 China
- 8.4.2 Japan
- 8.4.3 India
- 8.4.4 Australia
- 8.4.5 South Korea
- 8.5 Middle East & Africa
- 8.5.1 Saudi Arabia
- 8.5.2 UAE
- 8.5.3 Qatar
- 8.5.4 South Africa
- 8.6 Latin America
- 8.6.1 Brazil
- 8.6.2 Argentina
Chapter 9 Company Profiles
- 9.1 Allmand Bros
- 9.2 Aska Equipments
- 9.3 Atlas Copco
- 9.4 Caterpillar
- 9.5 Chicago Pneumatic
- 9.6 Colorado Standby
- 9.7 DMI
- 9.8 Doosan Portable Power
- 9.9 Generac Power Systems
- 9.10 HIMOINSA
- 9.11 Inmesol gensets
- 9.12 J C Bamford Excavators
- 9.13 Larson Electronics
- 9.14 Light Boy
- 9.15 LTA Projects
- 9.16 Multiquip
- 9.17 Olikara Lighting Towers
- 9.18 Progress Solar Solutions
- 9.19 Trime
- 9.20 United Rentals
- 9.21 Wacker Neuson
- 9.22 Youngman Richardson

