
PUBLISHER: Global Market Insights Inc. | PRODUCT CODE: 2061420

PUBLISHER: Global Market Insights Inc. | PRODUCT CODE: 2061420
Electric Motorcycle and Scooters Market Opportunity, Growth Drivers, Industry Trend Analysis, and Forecast 2026 - 2035
The Global Electric Motorcycle &Scooters Market was valued at USD 37.2 billion in 2025 and is estimated to grow at a CAGR of 13.7% to reach USD 129.9 billion by 2035.
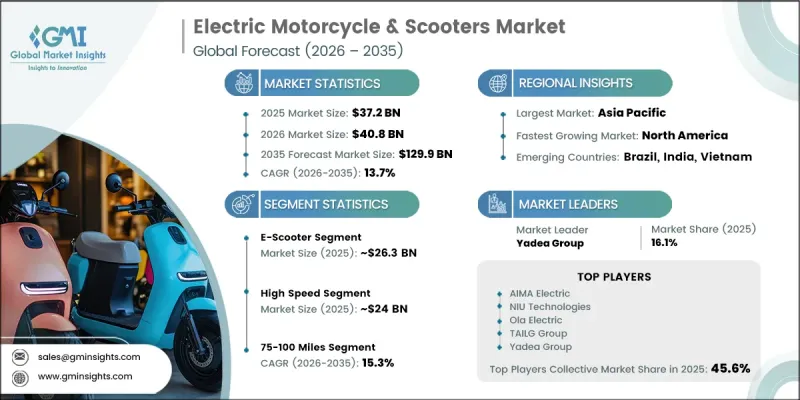
The market structure remains heavily concentrated in Asia Pacific, which accounted for 96.5% of total value in 2025, while North America and Europe currently represent smaller shares but are steadily expanding as charging infrastructure, dealership networks, and consumer awareness continue to improve. Market growth is strongly influenced by policy frameworks, where incentive schemes, tax benefits, and regulatory access advantages significantly lower upfront ownership costs and accelerate adoption rates. Economic fundamentals also play a central role, as lower per-kilometer operating costs compared to internal combustion vehicles and reduced long-term maintenance requirements strengthen the total cost of ownership advantage. These combined factors are increasing the attractiveness of electric two-wheelers for both personal mobility and commercial fleet applications, particularly in dense urban environments where utilization rates are high. Battery swapping models and shared charging ecosystems are further improving operational efficiency, enabling higher uptime and reducing dependency on fixed charging infrastructure.
| Market Scope | |
|---|---|
| Start Year | 2025 |
| Forecast Year | 2026-2035 |
| Start Value | $37.2 Billion |
| Forecast Value | $129.9 Billion |
| CAGR | 13.7% |
The e-scooter segment held a 70.8% share, generating USD 26.3 billion in 2025. This category continues to lead due to its strong alignment with short-distance urban commuting and delivery applications. Electric motorcycles, on the other hand, are increasingly positioned toward higher performance use cases where extended range, higher speed capability, and highway suitability are essential. Growing improvements in battery density and cost efficiency are gradually enabling electric motorcycles to achieve longer travel ranges, making them more competitive with conventional alternatives.
The high-speed segment accounted for 64.4% share in 2025, valued at USD 24 billion. High-speed electric two-wheelers are gaining momentum as technological improvements enhance acceleration, endurance, and overall riding performance. These vehicles are increasingly meeting highway-grade requirements, making them viable substitutes for internal combustion engine models used in daily commuting and long-distance travel.
U.S. Electric Motorcycle and Scooters Market reached USD 104.7 million in 2025 and is expected to grow at a CAGR of 15.6% from 2026 to 2035. The country represents approximately 83% of the regional market value, supported by early technology adoption and strong consumer interest in metropolitan areas. Urban centers characterized by dense populations, environmental awareness, and tech-oriented consumers continue to drive adoption, reinforcing steady market expansion.
Key players operating in the Global Electric Motorcycle &Scooters Industry include Yadea Group, TVS Motor, Hero MotoCorp, NIU Technologies, Gogoro, Ola Electric, AIMA Electric, Luyuan Electric, TAILG Group, and Zero Motorcycles. Companies in the electric motorcycle & scooters market are focusing heavily on battery innovation and cost optimization to improve driving range and reduce vehicle prices. They are expanding battery swapping and charging infrastructure partnerships to enhance convenience and increase adoption speed in urban areas. Strategic collaboration with energy providers, mobility platforms, and logistics operators is strengthening fleet deployment opportunities. Manufacturers are also investing in lightweight materials and advanced powertrain systems to improve vehicle efficiency and performance. In addition, digital integration through connected vehicle platforms, app-based fleet management, and predictive maintenance solutions is enhancing user experience. Expansion into emerging markets, coupled with localized production strategies and aggressive dealership growth, is further helping companies strengthen competitive positioning and capture long-term demand growth in both personal and commercial mobility segments.
Table of Contents
Chapter 1 Methodology
- 1.1 Research approach
- 1.2 Quality Commitments
- 1.2.1 GMI AI policy & data integrity commitment
- 1.3 Research Trail & Confidence Scoring
- 1.3.1 Research Trail Components
- 1.3.2 Scoring Components
- 1.4 Data Collection
- 1.5 Data mining sources
- 1.5.1 Paid sources
- 1.6 Base estimates and calculations
- 1.6.1 Base year calculation
- 1.7 Forecast model
- 1.7.1 Quantified market impact analysis
- 1.8 Research transparency addendum
- 1.8.1 Source attribution framework
- 1.8.2 Quality assurance metrics
- 1.8.3 Our commitment to trust
Chapter 2 Executive Summary
- 2.1 Industry 360° synopsis
- 2.2 Key market trends
- 2.2.1 Regional
- 2.2.2 Vehicle
- 2.2.3 Speed
- 2.2.4 Range
- 2.2.5 Battery
- 2.2.6 Power Output
- 2.2.7 Voltage
- 2.2.8 End-Use
- 2.2.9 Sales Channel
- 2.3 TAM analysis, 2026-2035
- 2.4 CXO perspectives: Strategic imperatives
Chapter 3 Industry Insights
- 3.1 Industry ecosystem analysis
- 3.1.1 Supplier landscape
- 3.1.2 Profit margin
- 3.1.3 Cost structure
- 3.1.4 Value addition at each stage
- 3.1.5 Factor affecting the value chain
- 3.1.6 Disruptions
- 3.2 Industry impact forces
- 3.2.1 Growth drivers
- 3.2.1.1 Stringent Emission Regulations & Climate Action Commitments
- 3.2.1.2 Rising Fuel Prices & Total Cost of Ownership Benefits
- 3.2.1.3 Government Incentives, Subsidies & Tax Benefits
- 3.2.1.4 Advancement in Battery Technology & Declining Battery Costs
- 3.2.2 Industry pitfalls and challenges
- 3.2.2.1 High Upfront Purchase Cost vs ICE Alternatives
- 3.2.2.2 Limited Charging Infrastructure & Range Anxiety
- 3.2.3 Market opportunities
- 3.2.3.1 Fleet Electrification in Logistics & Delivery Sectors
- 3.2.3.2 Battery Swapping Business Models & Infrastructure Plays
- 3.2.3.3 Export Opportunities from Low-Cost Manufacturing Hubs
- 3.2.1 Growth drivers
- 3.3 Technology and innovation landscape
- 3.3.1 Current technological trends
- 3.3.1.1 Lithium-ion Battery Systems (NMC / LFP)
- 3.3.1.2 BLDC (Brushless DC) Hub Motors
- 3.3.2 Emerging technologies
- 3.3.2.1 Solid-State Batteries
- 3.3.2.2 Swappable Battery Ecosystems
- 3.3.2.3 Wireless Inductive Charging
- 3.3.1 Current technological trends
- 3.4 Growth potential analysis
- 3.5 Pricing Analysis (Driven by Primary Research)
- 3.5.1 Historical Price Trend Analysis
- 3.5.2 Pricing Strategy by Player Type (Premium / Value / Cost-plus)
- 3.6 Regulatory landscape
- 3.6.1 North America
- 3.6.1.1 US - Environmental Protection Agency (EPA)
- 3.6.1.2 US - National Highway Traffic Safety Administration (NHTSA)
- 3.6.1.3 Canada - Transport Canada
- 3.6.2 Europe
- 3.6.2.1 EU - European Commission (Mobility and Transport/Green Deal framework)
- 3.6.2.2 Germany - Kraftfahrt-Bundesamt (KBA)
- 3.6.3 Asia Pacific
- 3.6.3.1 China - Ministry of Industry and Information Technology (MIIT)
- 3.6.3.2 India - Ministry of Road Transport and Highways (MoRTH)
- 3.6.4 LATAM
- 3.6.4.1 Brazil - CONTRAN
- 3.6.4.2 Brazil - Secretaria Nacional de Transito (SENATRAN)
- 3.6.5 MEA
- 3.6.5.1 Saudi Arabia - SASO
- 3.6.5.2 UAE - Ministry of Industry and Advanced Technology (MoIAT)
- 3.6.1 North America
- 3.7 Porter's analysis
- 3.8 PESTEL analysis
- 3.9 Trade Data Analysis (Driven by Paid Database)
- 3.9.1 Import/Export Volume & Value Trends
- 3.9.2 Key Trade Corridors & Tariff Impact
- 3.10 Capacity & Production Landscape (Driven by Primary Research)
- 3.10.1 Installed Capacity by Region & Key Producer
- 3.10.2 Capacity Utilization Rates & Expansion Pipelines
- 3.11 Cost breakdown analysis
- 3.11.1 Battery Pack Cost
- 3.11.2 Electric Powertrain Cost
- 3.11.3 Chassis & Mechanical Components Cost
- 3.11.4 Electronics Cost
- 3.11.5 Manufacturing & Assembly Cost
- 3.12 Patent analysis (Driven by Primary Research)
- 3.13 Sustainability and environmental aspects
- 3.13.1 Sustainable Practices
- 3.13.2 Waste Reduction Strategies
- 3.13.3 Energy Efficiency in Production
- 3.13.4 Eco-friendly Initiatives
- 3.13.5 Carbon Footprint Considerations
- 3.14 Impact of AI & generative AI on the market
- 3.14.1 AI-driven disruption of existing business models
- 3.14.2 GenAI use cases & adoption roadmap by segment
- 3.14.3 Risks, limitations & regulatory considerations
- 3.15 Charging infrastructure readiness
- 3.15.1 Public charging station density & geographic coverage
- 3.15.2 Charging standards & compatibility issues
- 3.15.3 Fast charging vs home charging economics
- 3.15.4 Battery swapping network development
- 3.15.5 Infrastructure investment gaps & future roadmap
- 3.16 Forecast assumptions & scenario analysis (Driven by Primary Research)
- 3.16.1 Base Case- Key Macro & Industry Variables Driving CAGR
- 3.16.2 Optimistic Scenarios- Favorable macro and industry tailwinds
- 3.16.3 Pessimistic Scenario - Macroeconomic slowdown or industry headwinds
Chapter 4 Competitive Landscape, 2025
- 4.1 Introduction
- 4.2 Company market share analysis
- 4.2.1 North America
- 4.2.2 Europe
- 4.2.3 Asia Pacific
- 4.2.4 LATAM
- 4.2.5 MEA
- 4.3 Competitive analysis of major market players
- 4.4 Competitive positioning matrix
- 4.5 Key developments
- 4.5.1 Mergers & acquisitions
- 4.5.2 Partnerships & collaborations
- 4.5.3 New product launches
- 4.5.4 Expansion plans and funding
- 4.6 Company tier benchmarking
- 4.6.1 Tier classification criteria & qualifying thresholds
- 4.6.2 Tier positioning matrix by revenue, geography & innovation
Chapter 5 Market Estimates and Forecast, By Vehicle, 2022 - 2035 ($ Mn, Units)
- 5.1 Key trends
- 5.2 E-Motorcycle
- 5.2.1 Dirt Bikes
- 5.2.2 Sports Motorcycles
- 5.2.3 Standard Motorcycles
- 5.2.3.1 Cruiser
- 5.2.3.2 Touring
- 5.2.3.3 Street/Naked
- 5.2.3.4 Adventure/Dual-Sport
- 5.2.3.5 Commuter
- 5.3 E-Scooter
- 5.3.1 Folding Scooters
- 5.3.2 Three-Wheeled Scooters
- 5.3.3 Standard Scooters
- 5.3.4 Mopeds
Chapter 6 Market Estimates and Forecast, By Speed, 2022 - 2035 ($ Mn, Units)
- 6.1 Key trends
- 6.2 Low Speed
- 6.3 High Speed
Chapter 7 Market Estimates and Forecast, By Range, 2022 - 2035 ($ Mn, Units)
- 7.1 Key trends
- 7.2 Below 75 Miles
- 7.3 75-100 Miles
- 7.4 Above 100 Miles
Chapter 8 Market Estimates and Forecast, By Battery, 2022 - 2035 ($ Mn, Units)
- 8.1 Key trends
- 8.2 Lead Acid
- 8.3 Lithium-ion
- 8.3.1 Lithium Iron Phosphate (LFP)
- 8.3.2 Nickel Manganese Cobalt (NMC)
Chapter 9 Market Estimates and Forecast, By Power Output, 2022 - 2035 ($ Mn, Units)
- 9.1 Key trends
- 9.2 Below 3 kW
- 9.3 3-10 kW
- 9.4 Above 10 kW
Chapter 10 Market Estimates and Forecast, By Voltage, 2022 - 2035 ($ Mn, Units)
- 10.1 Key trends
- 10.2 36V
- 10.3 48V
- 10.4 60V
- 10.5 72V
- 10.6 Others
Chapter 11 Market Estimates and Forecast, By End-Use, 2022 - 2035 ($ Mn, Units)
- 11.1 Key trends
- 11.2 Private/Individual
- 11.3 Commercial
- 11.3.1 Logistics & Delivery
- 11.3.2 Shared Mobility/Ride-sharing
- 11.3.3 Law Enforcement & Municipal Services
Chapter 12 Market Estimates and Forecast, By Sales Channel, 2022 - 2035 ($ Mn, Units)
- 12.1 Key trends
- 12.2 Online
- 12.3 Offline
Chapter 13 Market Estimates & Forecast, By Region, 2022 - 2035 ($Mn, Units)
- 13.1 Key trends
- 13.2 North America
- 13.2.1 US
- 13.2.2 Canada
- 13.3 Europe
- 13.3.1 Germany
- 13.3.2 UK
- 13.3.3 France
- 13.3.4 Italy
- 13.3.5 Spain
- 13.3.6 Netherlands
- 13.3.7 Norway
- 13.3.8 Sweden
- 13.3.9 Belgium
- 13.4 Asia Pacific
- 13.4.1 China
- 13.4.2 India
- 13.4.3 Japan
- 13.4.4 South Korea
- 13.4.5 Vietnam
- 13.4.6 Indonesia
- 13.4.7 Thailand
- 13.4.8 Philippines
- 13.5 Latin America
- 13.5.1 Brazil
- 13.5.2 Mexico
- 13.5.3 Argentina
- 13.5.4 Colombia
- 13.6 MEA
- 13.6.1 South Africa
- 13.6.2 Saudi Arabia
- 13.6.3 UAE
Chapter 14 Company Profiles
- 14.1 Global players
- 14.1.1 Yadea Group
- 14.1.2 NIU Technologies
- 14.1.3 Hero MotoCorp
- 14.1.4 Ola Electric
- 14.1.5 TAILG Group
- 14.1.6 Gogoro
- 14.1.7 TVS Motor
- 14.1.8 Yamaha Motor
- 14.1.9 Zero Motorcycles
- 14.1.10 Ather Energy
- 14.1.11 AIMA Electric
- 14.1.12 Honda
- 14.2 Regional players
- 14.2.1 Bajaj Auto
- 14.2.2 TORROT Electric
- 14.2.3 Oben Electric
- 14.2.4 Maeving
- 14.2.5 Mohenic Motors
- 14.2.6 Savic Motorcycles
- 14.3 Emerging players
- 14.3.1 Matter Motors
- 14.3.2 Ryvid

