
PUBLISHER: Global Market Insights Inc. | PRODUCT CODE: 1685114

PUBLISHER: Global Market Insights Inc. | PRODUCT CODE: 1685114
BEV On-Board Charger Market Opportunity, Growth Drivers, Industry Trend Analysis, and Forecast 2025 - 2034
The Global BEV On-Board Charger Market reached USD 19.7 billion in 2024 and is expected to expand at an exceptional CAGR of 20.1% from 2025 to 2034. The rise of electric vehicles (EVs) worldwide, coupled with the growing shift towards sustainable energy solutions, is driving this surge in demand. As consumers increasingly embrace electric mobility, there is an urgent need for faster and more efficient charging systems. This evolving landscape is encouraging manufacturers to innovate and produce on-board chargers with higher power ratings, reducing charging times significantly and enhancing user satisfaction. The accelerated shift to clean energy technologies is making EVs a preferred choice for eco-conscious drivers, which, in turn, accelerates the need for advanced charging infrastructure and on-board charger technologies that deliver convenience and reduced waiting times.
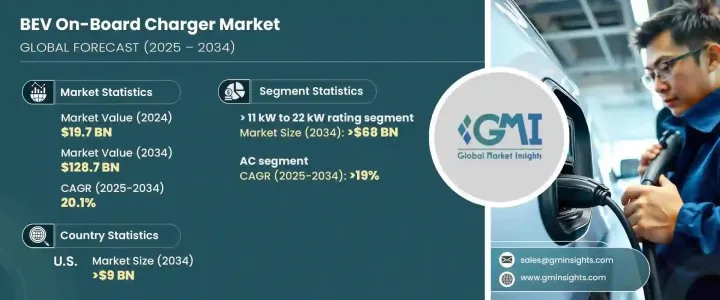
Among the key segments of the market, the BEV on-board chargers with power ratings ranging from 11 kW to 22 kW are projected to generate USD 68 billion by 2034. As electric vehicle owners demand quicker charging solutions, this segment is expected to grow rapidly. Manufacturers are responding by developing chargers that offer higher power outputs, allowing vehicles to charge faster and meet the growing needs of consumers who seek efficient, hassle-free charging experiences. This shift towards high-power charging systems aligns with global trends in EV adoption and charging infrastructure expansion, ensuring that the BEV market remains on an upward trajectory.
| Market Scope | |
|---|---|
| Start Year | 2024 |
| Forecast Year | 2025-2034 |
| Start Value | $19.7 Billion |
| Forecast Value | $128.7 Billion |
| CAGR | 20.1% |
Another significant trend is the rise of AC (alternating current) EV on-board chargers, which are anticipated to experience a CAGR of 19% through 2034. The increasing development of EV charging infrastructure in both residential and commercial areas is supporting this growth. AC chargers are cost-effective, and their widespread availability is enhancing accessibility for consumers looking to charge their electric vehicles at home or public charging stations. With significant investments being made in the expansion of both public and private charging networks, the demand for AC on-board chargers is steadily increasing, contributing to the market's overall growth.
The U.S. market for BEV on-board chargers is expected to generate USD 9 billion by 2034. The country's increasing adoption of electric vehicles, along with a growing demand for faster and more efficient charging solutions, is driving this market forward. Manufacturers are focusing on producing chargers within the 11 kW to 22 kW range to meet consumer expectations for quicker charge times. Efforts to standardize charging protocols are also underway, aiming to make the charging process more seamless and enhance interoperability between different EV models and chargers. The expansion of charging infrastructure, supported by favorable government policies, is further boosting the U.S. market and its growth potential.
Table of Contents
Chapter 1 Methodology & Scope
- 1.1 Market scope & definitions
- 1.2 Market estimates & forecast parameters
- 1.3 Forecast calculation
- 1.4 Data sources
- 1.4.1 Primary
- 1.4.2 Secondary
- 1.4.2.1 Paid
- 1.4.2.2 Public
Chapter 2 Executive Summary
- 2.1 Industry synopsis, 2021 - 2034
Chapter 3 Industry Insights
- 3.1 Industry ecosystem analysis
- 3.2 Regulatory landscape
- 3.3 Industry impact forces
- 3.3.1 Growth drivers
- 3.3.2 Industry pitfalls & challenges
- 3.4 Growth potential analysis
- 3.5 Porter's analysis
- 3.5.1 Bargaining power of suppliers
- 3.5.2 Bargaining power of buyers
- 3.5.3 Threat of new entrants
- 3.5.4 Threat of substitutes
- 3.6 PESTEL analysis
Chapter 4 Competitive Landscape, 2024
- 4.1 Introduction
- 4.2 Strategic outlook
- 4.3 Innovation & sustainability landscape
Chapter 5 Market Size and Forecast, By Rating, 2021 – 2034 (Units, USD Billion)
- 5.1 Key trends
- 5.2 < 11 kW
- 5.3 > 11 kW to 22 kW
- 5.4 > 22 kW
Chapter 6 Market Size and Forecast, By Current, 2021 – 2034 (Units, USD Billion)
- 6.1 Key trends
- 6.2 AC
- 6.3 DC
Chapter 7 Market Size and Forecast, By Region, 2021 – 2034 (Units, USD Billion)
- 7.1 Key trends
- 7.2 North America
- 7.2.1 U.S.
- 7.2.2 Canada
- 7.2.3 Mexico
- 7.3 Europe
- 7.3.1 Norway
- 7.3.2 Germany
- 7.3.3 France
- 7.3.4 Netherlands
- 7.3.5 UK
- 7.3.6 Sweden
- 7.4 Asia Pacific
- 7.4.1 China
- 7.4.2 Japan
- 7.4.3 India
- 7.4.4 South Korea
- 7.4.5 Australia
- 7.5 Middle East & Africa
- 7.5.1 Saudi Arabia
- 7.5.2 UAE
- 7.5.3 South Africa
- 7.6 Latin America
- 7.6.1 Brazil
- 7.6.2 Argentina
Chapter 8 Company Profiles
- 8.1 Bel Fuse
- 8.2 BorgWarner
- 8.3 Brusa Elektronik
- 8.4 Delta Energy Systems
- 8.5 Eaton
- 8.6 Ficosa Internacional
- 8.7 Hyundai Motor
- 8.8 Infineon Technologies
- 8.9 Innolectric
- 8.10 Nissan Motor
- 8.11 Phinia
- 8.12 Stercom Power Solutions
- 8.13 STMicroelectronics
- 8.14 Tesla
- 8.15 Toyota Industries
- 8.16 Valeo
- 8.17 Xepics Italia

