
PUBLISHER: Global Market Insights Inc. | PRODUCT CODE: 1667191

PUBLISHER: Global Market Insights Inc. | PRODUCT CODE: 1667191
Utility Electric Fuse Market Opportunity, Growth Drivers, Industry Trend Analysis, and Forecast 2025 - 2034
The Global Utility Electric Fuse Market, valued at USD 1.2 billion in 2024, is set for remarkable growth, projected to achieve a robust CAGR of 7% from 2025 to 2034. This expansion is fueled by the increasing demand for reliable electricity, in line with a worldwide push to modernize power infrastructure. With rapid industrialization and a growing global population driving electricity needs, utilities are ramping up the development and enhancement of power distribution networks to meet these evolving demands.
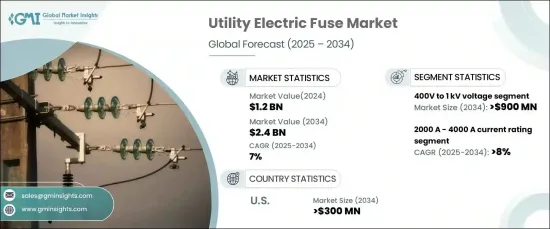
The voltage range of 400V to 1kV is forecasted to generate $900 million by 2034, driven by urbanization, industrial growth, and the expansion of electrical infrastructure. The increasing reliance on renewable energy sources, such as solar and wind power-often operating within this voltage range-further amplifies the segment's potential. Additionally, the adoption of smart fuse technologies offering real-time monitoring, remote diagnostics, and automated fault detection enhances the appeal of advanced fuse solutions in this segment.
| Market Scope | |
|---|---|
| Start Year | 2024 |
| Forecast Year | 2025-2034 |
| Start Value | $1.2 Billion |
| Forecast Value | $2.4 Billion |
| CAGR | 7% |
Fuses rated for 2000A to 4000A are anticipated to witness a robust CAGR of 8% from 2025 to 2034. This growth aligns with global efforts to modernize power grids and transition toward renewable energy. These high-current fuses are critical in protecting high-voltage equipment and ensuring consistent power distribution. They also safeguard essential infrastructure, including substations, transformers, and large-scale industrial systems, against faults and overloads, playing a pivotal role in supporting grid resilience and energy reliability.
The U.S. utility electric fuse market is projected to reach USD 300 million by 2034, driven by significant investments in grid upgrades, renewable energy integration, and advancements in energy technologies. The rapid electrification of transportation, particularly the increasing adoption of electric vehicles (EVs), is further fueling demand for durable and efficient fuse solutions. These fuses are essential for protecting EV charging systems and associated power infrastructure, ensuring seamless and safe energy transfer.
Table of Contents
Chapter 1 Methodology & Scope
- 1.1 Market definitions
- 1.2 Base estimates & calculations
- 1.3 Forecast calculation
- 1.4 Data sources
- 1.4.1 Primary
- 1.4.2 Secondary
- 1.4.2.1 Paid
- 1.4.2.2 Public
Chapter 2 Executive Summary
- 2.1 Industry 3600 synopsis, 2021 - 2034
Chapter 3 Industry Insights
- 3.1 Industry ecosystem analysis
- 3.2 Regulatory landscape
- 3.3 Industry impact forces
- 3.3.1 Growth drivers
- 3.3.2 Industry pitfalls & challenges
- 3.4 Growth potential analysis
- 3.5 Porter's analysis
- 3.5.1 Bargaining power of suppliers
- 3.5.2 Bargaining power of buyers
- 3.5.3 Threat of new entrants
- 3.5.4 Threat of substitutes
- 3.6 PESTEL analysis
Chapter 4 Competitive Landscape, 2024
- 4.1 Introduction
- 4.2 Strategic dashboard
- 4.3 Innovation & sustainability landscape
Chapter 5 Market Size and Forecast, By Voltage, 2021 – 2034 (USD Million, ‘000 Units)
- 5.1 Key trends
- 5.2 400V to 1 kV
- 5.3 1 kV to 11kV
- 5.4 11kV to 33kV
- 5.5 > 33kV
Chapter 6 Market Size and Forecast, By Current Rating, 2021 – 2034 (USD Million, ‘000 Units)
- 6.1 Key trends
- 6.2 2000-4000A
- 6.3 > 4000A
Chapter 7 Market Size and Forecast, By Region, 2021 – 2034 (USD Million, ‘000 Units)
- 7.1 Key trends
- 7.2 North America
- 7.2.1 U.S
- 7.2.2 Canada
- 7.2.3 Mexico
- 7.3 Europe
- 7.3.1 UK
- 7.3.2 France
- 7.3.3 Germany
- 7.3.4 Italy
- 7.3.5 Netherlands
- 7.4 Asia Pacific
- 7.4.1 China
- 7.4.2 Japan
- 7.4.3 India
- 7.4.4 South Korea
- 7.5 Middle East & Africa
- 7.5.1 Saudi Arabia
- 7.5.2 UAE
- 7.5.3 Turkey
- 7.6 Latin America
- 7.6.1 Brazil
- 7.6.2 Argentina
Chapter 8 Company Profiles
- 8.1 ABB
- 8.2 Bel Fuse
- 8.3 Denco Fuses
- 8.4 Eaton
- 8.5 Enerlux Power
- 8.6 Fuji Electric
- 8.7 General Electric
- 8.8 Hiitio New Energy
- 8.9 L&T Electrical & Automation
- 8.10 Littelfuse
- 8.11 Mersen
- 8.12 S&C Electric
- 8.13 Schneider Electric
- 8.14 SIBA

