
PUBLISHER: Global Market Insights Inc. | PRODUCT CODE: 1666608

PUBLISHER: Global Market Insights Inc. | PRODUCT CODE: 1666608
Alternative Fuel Vehicles (AFV) Market Opportunity, Growth Drivers, Industry Trend Analysis, and Forecast 2025 - 2034
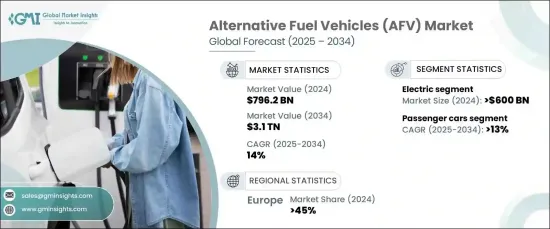
The Global Alternative Fuel Vehicles Market was valued at USD 796.2 billion in 2024 and is projected to expand at a CAGR of 14% between 2025 and 2034. This robust growth is primarily fueled by the increasing demand for sustainable transportation solutions, a shift towards cleaner mobility, and rising concerns over environmental sustainability. Governments across the globe are rolling out policies designed to reduce carbon emissions and encourage the transition to green alternatives.
Along with these government initiatives, technological breakthroughs in electric vehicle (EV) batteries and expanding charging infrastructure are making it easier for consumers to switch to electric options. The market growth is also being propelled by greater consumer awareness about the environmental impact of traditional fuel-driven vehicles, pushing automakers to invest heavily in the development of eco-friendly solutions. As the world continues to grapple with climate change and environmental degradation, alternative fuel vehicles are seen as an essential part of the solution.
| Market Scope | |
|---|---|
| Start Year | 2024 |
| Forecast Year | 2025-2034 |
| Start Value | $796.2 Billion |
| Forecast Value | $3.1 Trillion |
| CAGR | 14% |
The increasing focus on reducing dependence on fossil fuels, in line with the need to curb global carbon emissions, has led to substantial investments in electric vehicles (EVs). Government subsidies, tax breaks, and support for EV infrastructure are making electric mobility increasingly attractive to consumers. The demand for EVs is further fueled by rapid technological advancements in battery systems, enhancing driving ranges and charging speeds, which contribute to the vehicles' overall convenience. With more extensive charging networks in place, range anxiety, a significant barrier to EV adoption, is steadily diminishing. As electric vehicles become more accessible and affordable, their popularity is set to soar, contributing significantly to the overall market expansion.
The market is segmented by fuel type into electric vehicles, biofuels, and other alternative fuels. The electric vehicle segment alone generated USD 600 billion in 2024, and it is expected to experience substantial growth in the coming years. Factors driving this surge include heightened environmental awareness, improvements in battery technology, and government incentives that further encourage consumers to opt for electric cars. Automakers are also responding to this demand by diversifying their product lines, which will further fuel market expansion.
In terms of vehicle types, the market is divided into passenger cars and commercial vehicles. The passenger car segment is anticipated to experience a CAGR of 13% from 2025 to 2034. The surge in demand for eco-friendly transportation options is primarily driven by consumer preferences shifting toward cleaner, more energy-efficient vehicles. Both electric and hybrid vehicle technologies are expected to witness advancements spurred on by government initiatives and the growth of EV charging infrastructure, which together make these vehicles even more appealing.
In 2024, Europe accounted for 45% of the global market share in alternative fuel vehicles, largely due to the region's ambitious carbon neutrality targets and increased consumer focus on sustainability. European governments are supporting EV adoption through financial incentives, grants, and investment in charging networks, overcoming barriers like range anxiety and contributing to the widespread adoption of electric vehicles.
Table of Contents
Chapter 1 Methodology & Scope
- 1.1 Research design
- 1.1.1 Research approach
- 1.1.2 Data collection methods
- 1.2 Base estimates & calculations
- 1.2.1 Base year calculation
- 1.2.2 Key trends for market estimation
- 1.3 Forecast model
- 1.4 Primary research and validation
- 1.4.1 Primary sources
- 1.4.2 Data mining sources
- 1.5 Market scope & definition
Chapter 2 Executive Summary
- 2.1 Industry 3600 synopsis, 2021 - 2034
Chapter 3 Industry Insights
- 3.1 Industry ecosystem analysis
- 3.2 Supplier landscape
- 3.2.1 Technology providers
- 3.2.2 Service providers
- 3.2.3 Manufacturers
- 3.2.4 Distributors
- 3.2.5 End Use
- 3.3 Profit margin analysis
- 3.4 Technology & innovation landscape
- 3.5 Patent analysis
- 3.6 Regulatory landscape
- 3.7 Cost analysis
- 3.8 Case study
- 3.9 Impact forces
- 3.9.1 Growth drivers
- 3.9.1.1 Increasing fuel prices worldwide
- 3.9.1.2 Expanding charging infrastructure globally
- 3.9.1.3 Rising emphasis on cost-efficient batteries
- 3.9.1.4 Surge in government incentives and regulations
- 3.9.2 Industry pitfalls & challenges
- 3.9.2.1 High upfront costs
- 3.9.2.2 Limited availability of charging infrastructure
- 3.9.1 Growth drivers
- 3.10 Growth potential analysis
- 3.11 Porter’s analysis
- 3.12 PESTEL analysis
Chapter 4 Competitive Landscape, 2024
- 4.1 Introduction
- 4.2 Company market share analysis
- 4.3 Competitive positioning matrix
- 4.4 Strategic outlook matrix
Chapter 5 Market Estimates & Forecast, By Fuel, 2021 - 2034 ($Bn, Units)
- 5.1 Key trends
- 5.2 Electric
- 5.2.1 Battery Electric Vehicle (BEV)
- 5.2.2 Hybrid Electric Vehicle (HEV)
- 5.2.3 Plug-in Hybrid electric Vehicle (PHEV)
- 5.2.4 Fuel Cell Electric Vehicle (FCEV)
- 5.3 Biofuel
- 5.4 Others
Chapter 6 Market Estimates & Forecast, By Vehicle, 2021 - 2034 ($Bn, Units)
- 6.1 Key trends
- 6.2 Passenger vehicles
- 6.2.1 Hatchback
- 6.2.2 Sedan
- 6.2.3 SUV
- 6.3 Commercial vehicles
- 6.3.1 Light Commercial Vehicles (LCV)
- 6.3.2 Heavy Commercial Vehicles (HCV)
Chapter 7 Market Estimates & Forecast, By End Use, 2021 - 2034 ($Bn, Units)
- 7.1 Key trends
- 7.2 Commercial & fleet
- 7.3 Public transportation
- 7.4 Government & municipal
- 7.5 Others
Chapter 8 Market Estimates & Forecast, By Region, 2021 - 2034 ($Bn, Units)
- 8.1 Key trends
- 8.2 North America
- 8.2.1 U.S.
- 8.2.2 Canada
- 8.3 Europe
- 8.3.1 UK
- 8.3.2 Germany
- 8.3.3 France
- 8.3.4 Italy
- 8.3.5 Spain
- 8.3.6 Russia
- 8.3.7 Nordics
- 8.4 Asia Pacific
- 8.4.1 China
- 8.4.2 India
- 8.4.3 Japan
- 8.4.4 Australia
- 8.4.5 South Korea
- 8.4.6 Southeast Asia
- 8.5 Latin America
- 8.5.1 Brazil
- 8.5.2 Mexico
- 8.5.3 Argentina
- 8.6 MEA
- 8.6.1 UAE
- 8.6.2 South Africa
- 8.6.3 Saudi Arabia
Chapter 9 Company Profiles
- 9.1 Audi
- 9.2 BMW
- 9.3 BYD Company
- 9.4 Faraday Future
- 9.5 Fiat Chrysler Automobiles
- 9.6 Fisker
- 9.7 Ford Motor
- 9.8 General Motors
- 9.9 Honda Motors
- 9.10 Hyundai Motor
- 9.11 Kia
- 9.12 Lucid Motors
- 9.13 Mercedes-Benz
- 9.14 Nissan Motor
- 9.15 Polestar Automotive H
- 9.16 Rivian Automotive
- 9.17 Tesla
- 9.18 Toyota Motor
- 9.19 Volkswagen
- 9.20 Volvo

