
PUBLISHER: Global Market Insights Inc. | PRODUCT CODE: 1892843

PUBLISHER: Global Market Insights Inc. | PRODUCT CODE: 1892843
Gourmet Salts Market Opportunity, Growth Drivers, Industry Trend Analysis, and Forecast 2026 - 2035
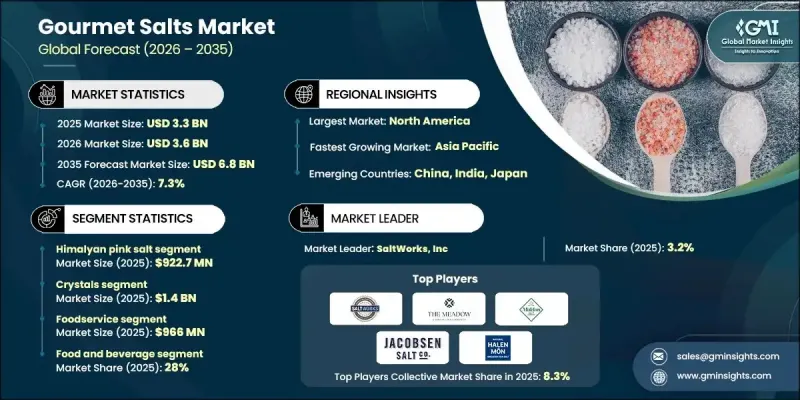
The Global Gourmet Salts Market was valued at USD 3.3 billion in 2025 and is estimated to grow at a CAGR of 7.3% to reach USD 6.8 billion by 2035.
Gourmet salts are distinguished by their unique mineral compositions, colors, textures, and flavors, setting them apart from standard table salt. These salts often contain natural trace minerals or specific crystallization patterns that enhance both taste and presentation. Many are sourced from specific marine environments, ancient salt beds, or volcanic regions, giving them a distinctive terroir, like specialty foods or fine wines. Technological advancements in harvesting, dehydration, and crystal formation have allowed producers to control the size, texture, and quality of these salts with precision. Enhanced mineral analysis and e-commerce platforms have expanded global access, while different textures from coarse to fine serve various culinary purposes. Flaky salts, for instance, provide a delicate crunch, making them highly sought after as finishing salts in culinary applications.
| Market Scope | |
|---|---|
| Start Year | 2025 |
| Forecast Year | 2026-2035 |
| Start Value | $3.3 Billion |
| Forecast Value | $6.8 Billion |
| CAGR | 7.3% |
The Himalayan pink salt segment generated USD 922.7 million in 2025. The market encompasses a wide range of salts, including sea salts, flake salts, and other specialty varieties, driven by rising consumer preference for natural, minimally processed, and mineral-rich ingredients. These salts are valued not only for their taste and visual appeal but also for enhancing the overall culinary experience in both professional and home kitchens.
The foodservice segment reached USD 966 million in 2025. Restaurants and catering services drive demand as chefs prioritize high-quality ingredients to elevate dining experiences. Household consumers are increasingly using gourmet salts for cooking and tabletop purposes, while the cosmetics and personal care industry leverages mineral-rich salts in bath and skincare products. The broad range of applications supports steady growth and innovation, fueled by changing consumer preferences and wellness trends.
U.S. Gourmet Salts Market garnered USD 1.07 billion in 2025. North American consumers are increasingly drawn to salts for their flavor, aesthetic appeal, and functional benefits. Smoked and flavored varieties are popular for adding complexity to everyday dishes, while mineral-enriched salts are incorporated into wellness products. Specialty retailers and online marketplaces make premium salts widely accessible, supporting market growth and visibility.
Key players in the Global Gourmet Salts Market include Redmond Real Salt (Redmond Life), SaltWorks, Inc., Murray River Salt (Sun Salt Pty Ltd), The Meadow, Alaska Pure Sea Salt Company, San Francisco Salt Company, Brittany Sea Salt, Sassi Salts, Le Guerandais, Halen Mon, Jacobsen Salt Co., Cargill Inc. / Morton Salt, Cheetham Salt Limited, The Salt Table, Louis Sel, Maldon Crystal Salt Company Ltd., Gilles Hervy, Amagansett Sea Salt Co., Celtic Sea Salt, and B Medical Systems. Market leaders focus on strategies such as expanding product lines with unique textures, flavors, and mineral compositions to meet diverse culinary and personal care demands. Companies invest in technological innovations in harvesting, drying, and crystallization to ensure consistent quality and enhance the sensory experience of their salts. Branding and storytelling around terroir, purity, and artisanal methods help differentiate offerings. Firms also leverage e-commerce platforms, social media campaigns, and partnerships with specialty retailers and restaurants to broaden reach and accessibility.
Table of Contents
Chapter 1 Methodology & Scope
- 1.1 Market scope and definition
- 1.2 Research design
- 1.2.1 Research approach
- 1.2.2 Data collection methods
- 1.3 Data mining sources
- 1.3.1 Global
- 1.3.2 Regional/Country
- 1.4 Base estimates and calculations
- 1.4.1 Base year calculation
- 1.4.2 Key trends for market estimation
- 1.5 Primary research and validation
- 1.5.1 Primary sources
- 1.6 Forecast model
- 1.7 Research assumptions and limitations
Chapter 2 Executive Summary
- 2.1 Industry 360° synopsis
- 2.2 Key market trends
- 2.2.1 Product type
- 2.2.2 Physical form
- 2.2.3 Application
- 2.2.4 End Use industry
- 2.2.5 Regional
- 2.3 TAM Analysis, 2025-2035
- 2.4 CXO perspectives: Strategic imperatives
- 2.4.1 Executive decision points
- 2.4.2 Critical success factors
- 2.5 Future outlook and strategic recommendations
Chapter 3 Industry Insights
- 3.1 Industry ecosystem analysis
- 3.1.1 Supplier landscape
- 3.1.2 Profit margin
- 3.1.3 Value addition at each stage
- 3.1.4 Factor affecting the value chain
- 3.1.5 Disruptions
- 3.2 Industry impact forces
- 3.2.1 Growth drivers
- 3.2.1.1 Rising consumer preference for natural products
- 3.2.1.2 Demand from premium culinary segments
- 3.2.1.3 Expansion of e-commerce and retail channels
- 3.2.2 Industry pitfalls and challenges
- 3.2.2.1 Quality and authenticity concerns
- 3.2.2.2 Storage and shelf-life issues
- 3.2.3 Market opportunities
- 3.2.3.1 Product innovation and flavored salts
- 3.2.3.2 Sustainable and eco-friendly practices
- 3.2.3.3 Expansion into emerging markets
- 3.2.1 Growth drivers
- 3.3 Growth potential analysis
- 3.4 Regulatory landscape
- 3.4.1 North America
- 3.4.2 Europe
- 3.4.3 Asia Pacific
- 3.4.4 Latin America
- 3.4.5 Middle East & Africa
- 3.5 Porter's analysis
- 3.6 PESTEL analysis
- 3.7 Technology and innovation landscape
- 3.7.1 Current technological trends
- 3.7.2 Emerging technologies
- 3.8 Price trends
- 3.8.1 By region
- 3.8.2 By product type
- 3.9 Future market trends
- 3.10 Technology and innovation landscape
- 3.10.1 Current technological trends
- 3.10.2 Emerging technologies
- 3.11 Patent landscape
- 3.12 Trade statistics (HS code) ( Note: the trade statistics will be provided for key countries only)
- 3.12.1 Major importing countries
- 3.12.2 Major exporting countries
- 3.13 Sustainability and environmental aspects
- 3.13.1 Sustainable practices
- 3.13.2 Waste reduction strategies
- 3.13.3 Energy efficiency in production
- 3.13.4 Eco-friendly initiatives
- 3.14 Carbon footprint consideration
Chapter 4 Competitive Landscape, 2025
- 4.1 Introduction
- 4.2 Company market share analysis
- 4.2.1 By region
- 4.2.1.1 North America
- 4.2.1.2 Europe
- 4.2.1.3 Asia Pacific
- 4.2.1.4 LATAM
- 4.2.1.5 MEA
- 4.2.1 By region
- 4.3 Company matrix analysis
- 4.4 Competitive analysis of major market players
- 4.5 Competitive positioning matrix
- 4.6 Key developments
- 4.6.1 Mergers & acquisitions
- 4.6.2 Partnerships & collaborations
- 4.6.3 New product launches
- 4.6.4 Expansion plans
Chapter 5 Market Estimates and Forecast, By Product Type, 2022-2035 (USD Million) (Kilo Tons)
- 5.1 Key trends
- 5.2 Sea Salt
- 5.3 Fleur de Sel
- 5.4 Sel Gris (Celtic Grey Salt)
- 5.5 Himalayan Pink Salt
- 5.6 Flake Salt
- 5.7 Hawaiian Salt (Red/Black)
- 5.8 Smoked Salt
- 5.9 Black Salt (Kala Namak)
- 5.10 Flavored & Infused Salts
Chapter 6 Market Estimates and Forecast, By Product Form, 2022-2035 (USD Million) (Kilo Tons)
- 6.1 Key trends
- 6.2 Crystals
- 6.3 Flakes
- 6.4 Powder
Chapter 7 Market Estimates and Forecast, By Application, 2022-2035 (USD Million) (Kilo Tons)
- 7.1 Key trends
- 7.2 Bakery and confectionery
- 7.3 Meat and Poultry Products
- 7.4 Seafood products
- 7.5 Sauces and savories
- 7.6 Food processing
- 7.7 Foodservice
- 7.8 Household / retail
- 7.9 Cosmetics and personal care
Chapter 8 Market Estimates and Forecast, By End Use Industry, 2022-2035 (USD Million) (Kilo Tons)
- 8.1 Key trends
- 8.2 Food and beverage industry
- 8.3 Professional culinary and fine dining
- 8.4 Specialty food manufacturing
- 8.5 Hospitality sector
- 8.6 Retail consumers
- 8.7 Health and wellness
Chapter 9 Market Estimates and Forecast, By Region, 2022-2035 (USD Million) (Kilo Tons)
- 9.1 Key trends
- 9.2 North America
- 9.2.1 U.S.
- 9.2.2 Canada
- 9.2.3 Mexico
- 9.3 Europe
- 9.3.1 Germany
- 9.3.2 UK
- 9.3.3 France
- 9.3.4 Spain
- 9.3.5 Italy
- 9.3.6 Rest of Europe
- 9.4 Asia Pacific
- 9.4.1 China
- 9.4.2 India
- 9.4.3 Japan
- 9.4.4 Australia
- 9.4.5 South Korea
- 9.4.6 Rest of Asia Pacific
- 9.5 Latin America
- 9.5.1 Brazil
- 9.5.2 Mexico
- 9.5.3 Argentina
- 9.5.4 Rest of Latin America
- 9.6 Middle East and Africa
- 9.6.1 Saudi Arabia
- 9.6.2 South Africa
- 9.6.3 UAE
- 9.6.4 Rest of Middle East and Africa
Chapter 10 Company Profiles
- 10.1 Alaska Pure Sea Salt Company
- 10.2 Amagansett Sea Salt Co.
- 10.3 Bitterman Salt Co.
- 10.4 Brittany Sea Salt
- 10.5 Celtic Sea Salt
- 10.6 Cargill Inc. / Morton Salt
- 10.7 Cheetham Salt Limited
- 10.8 Gilles Hervy
- 10.9 Halen Mon
- 10.10 Infosa
- 10.11 Jacobsen Salt Co.
- 10.12 Le Guerandais
- 10.13 Louis Sel
- 10.14 Maldon Crystal Salt Company Ltd.
- 10.15 Murray River Salt (Sun Salt Pty Ltd)
- 10.16 Pyramid Salt (Sun Salt / Pyramid Hill)
- 10.17 Redmond Real Salt (Redmond Life)
- 10.18 SaltWorks, Inc.
- 10.19 San Francisco Salt Company
- 10.20 Sassi Salts
- 10.21 The Meadow
- 10.22 The Salt Table

