
PUBLISHER: Global Market Insights Inc. | PRODUCT CODE: 1716627

PUBLISHER: Global Market Insights Inc. | PRODUCT CODE: 1716627
Retinoblastoma Treatment Market Opportunity, Growth Drivers, Industry Trend Analysis, and Forecast 2025 - 2034
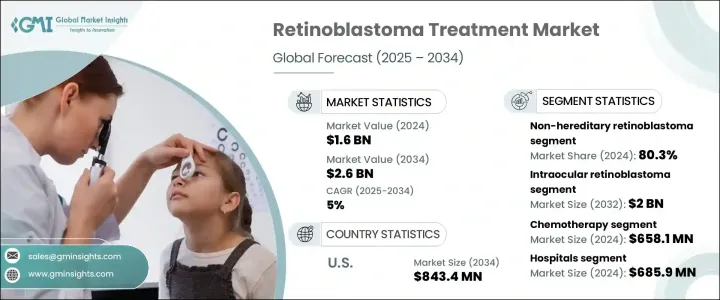
The Global Retinoblastoma Treatment Market was valued at USD 1.6 billion in 2024 and is projected to grow at a CAGR of 5% between 2025 and 2034. This growth is primarily driven by the rising incidence of retinoblastoma, increasing advancements in targeted therapies, and continuous innovations in ocular oncology. With the prevalence of this rare but serious eye cancer rising among children, the need for effective treatment strategies has never been more critical. Research institutions and pharmaceutical companies are aggressively investing in the development of novel therapies that can enhance patient outcomes while minimizing adverse effects.
Governments and healthcare organizations worldwide are launching awareness campaigns to promote early diagnosis, significantly improving survival rates. The availability of advanced treatment modalities, including intra-arterial chemotherapy and intravitreal chemotherapy, is transforming the landscape of retinoblastoma management. Emerging technologies, such as gene therapy and precision medicine, are further driving optimism in the market. Additionally, the integration of artificial intelligence in ocular oncology is helping specialists detect retinoblastoma at earlier stages, improving treatment efficacy. With major hospitals and cancer centers expanding pediatric oncology units, access to specialized retinoblastoma care is becoming more widespread, fueling market expansion.
| Market Scope | |
|---|---|
| Start Year | 2024 |
| Forecast Year | 2025-2034 |
| Start Value | $1.6 Billion |
| Forecast Value | $2.6 Billion |
| CAGR | 5% |
The market for retinoblastoma treatment is segmented into intraocular and extraocular retinoblastoma. The intraocular segment is expected to generate USD 2 billion by 2032, driven by the rising incidence of intraocular retinoblastoma cases and the growing adoption of innovative treatment methods. The increasing preference for intravitreal and intra-arterial chemotherapy is significantly contributing to this segment's growth, as these methods help reduce systemic toxicity compared to traditional chemotherapy. Patients and healthcare providers are actively seeking treatment options that offer improved efficacy while minimizing long-term side effects, which is further propelling market demand.
In terms of end-use, hospitals dominated the retinoblastoma treatment market, generating USD 685.9 million in 2024. With hospitals making significant investments in oncology and specialized pediatric ophthalmology units, multidisciplinary teams comprising ophthalmologists, genetic specialists, and oncologists are collaborating to develop targeted treatment approaches. The integration of chemotherapy centers within hospital settings is enhancing treatment accessibility, positioning hospitals as key players in retinoblastoma management. As medical institutions continue to adopt cutting-edge technologies and treatment protocols, the hospital segment is set to witness sustained growth over the coming years.
U.S. retinoblastoma treatment market generated USD 525.5 million in 2024, with rising cases attributed to the increasing prevalence of RB1 gene mutations among children. The National Cancer Institute and the American Cancer Society are actively promoting early detection initiatives through awareness campaigns, which are accelerating the demand for advanced treatment options. Leading healthcare providers across the U.S. are investing in novel therapies, clinical trials, and specialized pediatric oncology centers to improve patient outcomes. With continued advancements in precision medicine and targeted treatment approaches, the U.S. is expected to remain a dominant player in the global retinoblastoma treatment market.
Table of Contents
Chapter 1 Methodology and Scope
- 1.1 Market scope and definitions
- 1.2 Research design
- 1.2.1 Research approach
- 1.2.2 Data collection methods
- 1.3 Base estimates and calculations
- 1.3.1 Base year calculation
- 1.3.2 Key trends for market estimation
- 1.4 Forecast model
- 1.5 Primary research and validation
- 1.5.1 Primary sources
- 1.5.2 Data mining sources
Chapter 2 Executive Summary
- 2.1 Industry 360° Synopsis
Chapter 3 Industry Insights
- 3.1 Industry ecosystem analysis
- 3.2 Industry impact forces
- 3.2.1 Growth drivers
- 3.2.1.1 Increasing incidence of retinoblastoma
- 3.2.1.2 Early diagnosis and treatment of retinoblastoma
- 3.2.2 Industry pitfalls and challenges
- 3.2.2.1 High treatment cost
- 3.2.2.2 Side effects associated with retinoblastoma treatment
- 3.2.1 Growth drivers
- 3.3 Growth potential analysis
- 3.4 Regulatory landscape
- 3.5 Technological landscape
- 3.6 Future market trends
- 3.7 Gap analysis
- 3.8 Patent analysis
- 3.9 Pipeline analysis
- 3.10 Porter's analysis
- 3.11 PESTEL analysis
Chapter 4 Competitive Landscape, 2024
- 4.1 Introduction
- 4.2 Company market share analysis
- 4.3 Company matrix analysis
- 4.4 Competitive analysis of major market players
- 4.5 Competitive positioning matrix
- 4.6 Strategy dashboard
Chapter 5 Market Estimates and Forecast, By Disease Type, 2021 – 2034 ($ Mn)
- 5.1 Key trends
- 5.2 Non-hereditary retinoblastoma
- 5.3 Hereditary retinoblastoma
Chapter 6 Market Estimates and Forecast, By Disease Stage, 2021 – 2034 ($ Mn)
- 6.1 Key trends
- 6.2 Intraocular retinoblastoma
- 6.3 Extraocular retinoblastoma
Chapter 7 Market Estimates and Forecast, By Treatment Type, 2021 – 2034 ($ Mn)
- 7.1 Key trends
- 7.2 Chemotherapy
- 7.3 Radiation therapy
- 7.4 Surgery
- 7.5 Laser therapy
- 7.6 Cryotherapy
Chapter 8 Market Estimates and Forecast, By End Use, 2021 – 2034 ($ Mn)
- 8.1 Key trends
- 8.2 Hospitals
- 8.3 Cancer treatment center
- 8.4 Specialty eye clinics
Chapter 9 Market Estimates and Forecast, By Region, 2021 – 2034 ($ Mn)
- 9.1 Key trends
- 9.2 North America
- 9.2.1 U.S.
- 9.2.2 Canada
- 9.3 Europe
- 9.3.1 Germany
- 9.3.2 UK
- 9.3.3 France
- 9.3.4 Spain
- 9.3.5 Italy
- 9.3.6 Netherlands
- 9.4 Asia Pacific
- 9.4.1 China
- 9.4.2 Japan
- 9.4.3 India
- 9.4.4 Australia
- 9.4.5 South Korea
- 9.5 Latin America
- 9.5.1 Brazil
- 9.5.2 Mexico
- 9.5.3 Argentina
- 9.6 Middle East and Africa
- 9.6.1 South Africa
- 9.6.2 Saudi Arabia
- 9.6.3 UAE
Chapter 10 Company Profiles
- 10.1 Advancium Health
- 10.2 Baxter International
- 10.3 Bristol-Myers Squibb Company
- 10.4 Cadila Pharmaceuticals
- 10.5 Cellceutix Corporation
- 10.6 GlaxoSmithKline
- 10.7 Johnson & Johnson
- 10.8 Merck & Co.
- 10.9 Novartis
- 10.10 Pfizer
- 10.11 Teva Pharmaceutical Industries
- 10.12 Theriva Biologics

