
PUBLISHER: Global Market Insights Inc. | PRODUCT CODE: 1766301

PUBLISHER: Global Market Insights Inc. | PRODUCT CODE: 1766301
U.S. Integrated Delivery Networks Market Opportunity, Growth Drivers, Industry Trend Analysis, and Forecast 2025 - 2034
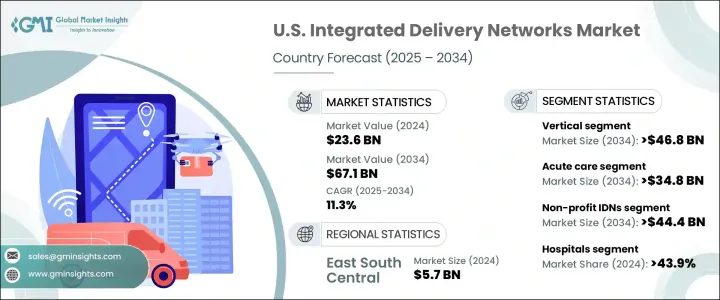
U.S. Integrated Delivery Networks Market was valued at USD 23.6 billion in 2024 and is estimated to grow at a CAGR of 11.3% to reach USD 67.1 billion by 2034. The rapid market expansion is largely driven by the shift toward value-based healthcare models, the growing need for cost efficiency, and the increasing emphasis on improving population health management. As healthcare systems seek to provide more comprehensive and coordinated care, IDNs have become essential for managing chronic conditions and improving patient outcomes.
These networks enable a streamlined approach to care, reducing inefficiencies and promoting better health management. The transition to outpatient services, bolstered by government incentives, has also made integrated care delivery more prevalent, particularly for organizations focusing on reducing operational costs and improving the quality of care. The adoption of IDNs has helped hospitals and providers address the needs of an aging population and those with complex health issues by enhancing care coordination, patient access, and the overall patient experience.
| Market Scope | |
|---|---|
| Start Year | 2024 |
| Forecast Year | 2025-2034 |
| Start Value | $23.6 Billion |
| Forecast Value | $67.1 Billion |
| CAGR | 11.3% |
The vertical integration segment is projected to grow at a CAGR of 11.4%, expected to reach USD 46.8 billion by 2034. Vertical integration brings together various healthcare services, such as hospitals, primary care, outpatient services, pharmacy, and specialty care, into a unified system. This integration streamlines the delivery of care, helping to reduce fragmentation and waste while improving patient outcomes and operational efficiency. By consolidating these services, vertical IDNs can reduce administrative costs, enhance coordination, and better manage resources across the care continuum. This model is particularly effective at controlling rising healthcare costs by minimizing redundant procedures and unnecessary hospital readmissions while ensuring a more cohesive and patient-centered approach to care.
The acute care segment will grow at a CAGR of 11.1% and is projected to reach USD 34.8 billion by 2034. Acute care is a crucial element of IDNs, providing immediate and short-term treatment for illnesses, surgeries, and injuries. Acute care services play a pivotal role in helping healthcare providers address critical health conditions, such as advanced cancer, heart disease, kidney problems, and chronic respiratory conditions. This segment supports essential patient management by integrating emergency services, intensive care, and surgical care under a unified network, improving care efficiency, and fostering better collaboration between healthcare professionals.
East South Central Integrated Delivery Networks Market was valued at USD 5.7 billion in 2024 and is anticipated to grow at a CAGR of 11.9% from 2025 to 2034. In states like Kentucky, Tennessee, Alabama, and Mississippi, where access to specialized care is often limited, IDNs are playing a vital role in expanding access to essential healthcare services. By focusing on value-based care and leveraging federal and state funding, IDNs are working to address health disparities, improve outcomes, and enhance care management. The high enrollment rates in Medicaid and Medicare in this region are significantly expanding IDNs, as healthcare providers aim to deliver more affordable and comprehensive care.
Key players in the U.S. Integrated Delivery Networks Market include Kaiser Permanente, Intermountain Healthcare, Ascension, Trinity Health, UnitedHealth Group, HCA Healthcare, Providence, Cleveland Clinic, Geisinger, Banner Health, Partners Healthcare, CHS Community Health Systems, UPMC Health Plan, and CommonSpirit. To strengthen their position in the U.S. integrated delivery networks market, companies are adopting several strategic initiatives.
These include forming strategic partnerships and acquisitions to broaden their service offerings and expand geographic reach. Investment in technology and innovation is a key focus, with organizations increasingly utilizing data analytics and digital health tools to enhance care coordination and operational efficiency. Many IDNs are also focusing on integrating outpatient and specialized services to offer a more comprehensive, patient-centered approach to care. Furthermore, by improving patient engagement through digital platforms and mobile health solutions, healthcare providers are better equipped to manage chronic conditions and deliver preventive care.
Table of Contents
Chapter 1 Methodology and Scope
- 1.1 Market scope and definitions
- 1.2 Research design
- 1.2.1 Research approach
- 1.2.2 Data collection methods
- 1.3 Data mining sources
- 1.3.1 Global
- 1.3.2 Regional/country
- 1.4 Base estimates and calculations
- 1.4.1 Base year calculation
- 1.4.2 Key trends for market estimation
- 1.5 Primary research and validation
- 1.5.1 Primary sources
- 1.6 Forecast model
- 1.7 Research assumptions and limitations
Chapter 2 Executive Summary
- 2.1 Industry 3600 synopsis
- 2.2 CXO perspectives: Strategic imperatives
- 2.2.1 Key decision points for industry executives
- 2.2.2 Critical success factors for market players
Chapter 3 Industry Insights
- 3.1 Industry ecosystem analysis
- 3.2 Industry impact forces
- 3.2.1 Growth drivers
- 3.2.1.1 Growing demand for value-based healthcare services
- 3.2.1.2 Increasing prevalence of chronic diseases
- 3.2.1.3 Favorable government policies and incentives
- 3.2.1.4 Surging demand for accountable care and clinical integration
- 3.2.2 Industry pitfalls and challenges
- 3.2.2.1 Lack of healthcare professionals and interoperability issues with different stakeholders
- 3.2.3 Market opportunities
- 3.2.3.1 Surge in data analytics & interoperability services
- 3.2.1 Growth drivers
- 3.3 Growth potential analysis
- 3.4 Regulatory landscape
- 3.5 Technology landscape
- 3.6 Gap analysis
- 3.7 Porter's analysis
- 3.8 PESTEL analysis
- 3.9 Value chain analysis
- 3.10 Integrated delivery networks - investment outlook
- 3.11 Start-up scenario
Chapter 4 Competitive Landscape, 2024
- 4.1 Introduction
- 4.2 Company matrix analysis
- 4.3 Competitive analysis of major market players
- 4.4 Competitive positioning matrix
- 4.5 Strategy dashboard
- 4.6 Key developments
- 4.6.1 Mergers & acquisitions
- 4.6.2 Partnerships & collaborations
- 4.6.3 New service launches
- 4.6.4 Expansion plans
Chapter 5 Market Estimates and Forecast, By Integration Model, 2021 - 2034 ($ Mn)
- 5.1 Key trends
- 5.2 Vertical
- 5.3 Horizontal
Chapter 6 Market Estimates and Forecast, By Service Type, 2021 - 2034 ($ Mn)
- 6.1 Key trends
- 6.2 Acute care
- 6.3 Specialty care
- 6.4 Primary care
- 6.5 Long-term health
- 6.6 Other service types
Chapter 7 Market Estimates and Forecast, By Ownership Type, 2021 - 2034 ($ Mn)
- 7.1 Key trends
- 7.2 Non-profit IDNs
- 7.3 For-profit IDNs
- 7.4 Government-owned IDNs
Chapter 8 Market Estimates and Forecast, By Component, 2021 - 2034 ($ Mn)
- 8.1 Key trends
- 8.2 Hospitals
- 8.3 Physician groups
- 8.4 Ambulatory surgery centers
- 8.5 Health clinics
- 8.6 Imaging centers
- 8.7 Post-acute care centers
Chapter 9 Market Estimates and Forecast, By Zone, 2021 - 2034 ($ Mn)
- 9.1 Key trends
- 9.2 East South Central
- 9.3 West South Central
- 9.4 South Atlantic
- 9.5 Mountain States
- 9.6 East North Central
- 9.7 Northeast
- 9.8 Pacific Central
- 9.9 West North Central
Chapter 10 Company Profiles
- 10.1 Ascension
- 10.2 Banner Health
- 10.3 CHS Community Health Systems
- 10.4 Cleveland Clinic
- 10.5 CommonSpirit
- 10.6 Geisinger
- 10.7 HCA Healthcare
- 10.8 Intermountain Healthcare
- 10.9 KAISER PERMANENTE
- 10.10 PARTNERS HEALTHCARE
- 10.11 Providence
- 10.12 TH Medical
- 10.13 Trinity Health
- 10.14 UNITEDHEALTH GROUP
- 10.15 UPMC HEALTH PLAN

