
PUBLISHER: Global Market Insights Inc. | PRODUCT CODE: 1892767

PUBLISHER: Global Market Insights Inc. | PRODUCT CODE: 1892767
Sensor Based Sorting Machines for Mining Market Opportunity, Growth Drivers, Industry Trend Analysis, and Forecast 2026 - 2035
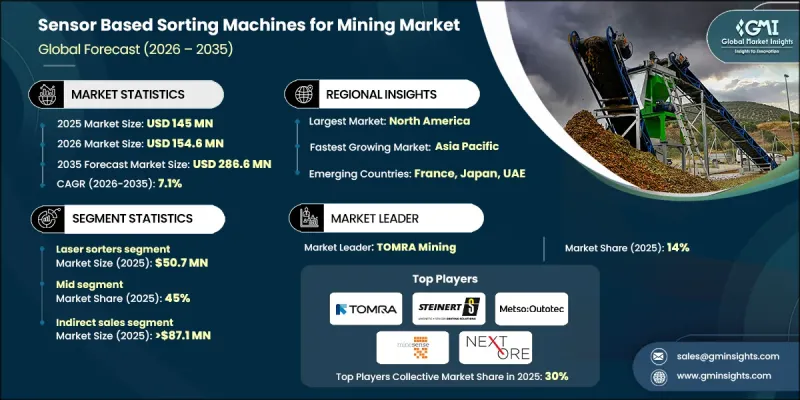
The Global Sensor Based Sorting Machines for Mining Market was valued at USD 145 million in 2025 and is estimated to grow at a CAGR of 7.1% to reach USD 286.6 million by 2035.
Market growth is driven by rising global demand for base metals, precious metals, and industrial minerals, supported by infrastructure expansion, accelerating urban development, and the ongoing energy transition. These structural shifts are increasing the need for materials such as copper and nickel, which in turn is raising overall mining volumes. As production scales up, mining operators are under pressure to improve efficiency while controlling waste generation. Sensor-based sorting enables early-stage ore pre-concentration, allowing operators to separate valuable material before downstream processing. This improves recovery rates and reduces environmental impact by lowering energy and water consumption. As mining activity increasingly shifts toward lower-grade deposits and geographically remote locations, conventional beneficiation methods are becoming more complex and costly. Sensor-driven sorting technologies allow selective processing that minimizes unnecessary material movement and reduces the load on milling operations. These systems support higher overall productivity while aligning with stricter sustainability targets, positioning sensor-based sorting as a core technology in modern mining operations focused on efficiency, cost control, and environmental responsibility.
| Market Scope | |
|---|---|
| Start Year | 2025 |
| Forecast Year | 2026-2035 |
| Start Value | $145 Million |
| Forecast Value | $286.6 Million |
| CAGR | 7.1% |
The laser sorter segment generated USD 50.7 million in 2025. These systems rely on advanced laser-based sensing to evaluate ore particles using surface and compositional characteristics. By analyzing mineral texture, reflectivity, and elemental composition, laser sorting delivers higher selectivity than density- or color-based methods. This analytical capability is achieved through laser-induced breakdown spectroscopy, where high-energy pulses create measurable spectra used to identify mineral properties with precision.
The mid-capacity systems segment accounted for a 45% share in 2025. These machines typically process between 150 and 350 tons per hour, placing them between small modular units and full-scale industrial installations. They are commonly deployed for primary or secondary pre-concentration and are designed to maintain consistent throughput without disrupting downstream circuits. Their use supports waste removal before grinding, reduces reagent consumption, and stabilizes feed variability.
US Sensor Based Sorting Machines for Mining Market held 75.6% share and generated USD 109.6 million in 2025. Strong mining activity, advanced operational infrastructure, and a focus on productivity optimization support market leadership. Mining operators in the country have widely adopted sensor-based technologies to improve resource utilization while minimizing environmental impact.
Key companies active in the Global Sensor Based Sorting Machines for Mining Market include TOMRA Systems, Metso, STEINERT, REDWAVE, FLSmidth, Buhler Group, Sesotec, Binder+Co AG, Eriez Manufacturing, NextOre, MineSense Technologies, Scantech, HPY Sorting Technology, Comex, and Pellenc ST. Companies operating in the Sensor Based Sorting Machines for Mining Market are reinforcing their competitive position through continuous technology development, strategic collaborations, and expanded global presence. Manufacturers are investing in advanced sensing capabilities, artificial intelligence integration, and data analytics to improve sorting accuracy and throughput. Partnerships with mining operators enable customized solutions that align with specific ore characteristics and operational requirements. Many players focus on modular system designs that allow flexible deployment and scalability across mine sizes.
Table of Contents
Chapter 1 Methodology and Scope
- 1.1 Market scope and definition
- 1.2 Research design
- 1.2.1 Research approach
- 1.2.2 Data collection methods
- 1.3 Data mining sources
- 1.3.1 Global
- 1.3.2 Regional/Country
- 1.4 Base estimates and calculations
- 1.4.1 Base year calculation
- 1.4.2 Key trends for market estimation
- 1.5 Primary research and validation
- 1.5.1 Primary sources
- 1.6 Forecast model
- 1.7 Research assumptions and limitations
Chapter 2 Executive Summary
- 2.1 Industry 3600 synopsis
- 2.2 Key market trends
- 2.2.1 Regional
- 2.2.2 Technology
- 2.2.3 Capacity
- 2.2.4 Application
- 2.2.5 Distribution channel
- 2.3 CXO perspectives: Strategic imperatives
- 2.3.1 Key decision points for industry executives
- 2.3.2 Critical success factors for market players
- 2.4 Future outlook and strategic recommendations
Chapter 3 Industry Insights
- 3.1 Industry ecosystem analysis
- 3.1.1 Supplier landscape
- 3.1.2 Profit margin
- 3.1.3 Value addition at each stage
- 3.1.4 Factor affecting the value chain
- 3.2 Industry impact forces
- 3.2.1 Growth drivers
- 3.2.1.1 Increasing mining activities
- 3.2.1.2 Operational cost savings
- 3.2.1.3 Demand for critical minerals
- 3.2.2 Industry pitfalls & challenges
- 3.2.2.1 High upfront costs
- 3.2.2.2 Integration complexity
- 3.2.3 Opportunities
- 3.2.3.1 Automation & AI integration
- 3.2.3.2 Customized sensor solutions
- 3.2.1 Growth drivers
- 3.3 Growth potential analysis
- 3.4 Future market trends
- 3.5 Technology and innovation landscape
- 3.5.1 Current technological trends
- 3.5.2 Emerging technologies
- 3.6 Price trends
- 3.6.1 By region
- 3.6.2 By operating system
- 3.7 Regulatory landscape
- 3.7.1 Standards and compliance requirements
- 3.7.2 Regional regulatory frameworks
- 3.7.3 Certification standards
- 3.8 Porter's analysis
- 3.9 PESTEL analysis
Chapter 4 Competitive Landscape, 2025
- 4.1 Introduction
- 4.2 Company market share analysis
- 4.2.1 By region
- 4.2.1.1 North America
- 4.2.1.2 Europe
- 4.2.1.3 Asia Pacific
- 4.2.1.4 Latin America
- 4.2.1.5 Middle East and Africa
- 4.2.1 By region
- 4.3 Company matrix analysis
- 4.4 Competitive analysis of major market players
- 4.5 Competitive positioning matrix
- 4.6 Key developments
- 4.6.1 Mergers & acquisitions
- 4.6.2 Partnerships & collaborations
- 4.6.3 New product launches
- 4.6.4 Expansion plans
Chapter 5 Market Estimates and Forecast, By Technology, 2022 - 2035 (USD Million) (Thousand Units)
- 5.1 Key trends
- 5.2 Laser sorters
- 5.3 X-Ray transmission
- 5.4 Color based
- 5.5 Near infrared
- 5.6 LIBS technology
- 5.7 Others (XRF, eddy current)
Chapter 6 Market Estimates and Forecast, By Capacity, 2022 - 2035 (USD Million) (Thousand Units)
- 6.1 Key trends
- 6.2 Low (less than 150 tons/hr.)
- 6.3 Mid (150-350 tons/hr.)
- 6.4 High (more than 350 tons/hr.)
Chapter 7 Market Estimates and Forecast, By Application, 2022 - 2035 (USD Million) (Thousand Units)
- 7.1 Key trends
- 7.2 Metallic
- 7.3 Nonmetallic
Chapter 8 Market Estimates and Forecast, By Distribution Channel, 2022 - 2035 (USD Million) (Thousand Units)
- 8.1 Key trends
- 8.2 Direct sales
- 8.3 Indirect sales
Chapter 9 Market Estimates and Forecast, By Region, 2022 - 2035 (USD Million) (Thousand Units)
- 9.1 Key trends
- 9.2 North America
- 9.2.1 U.S.
- 9.2.2 Canada
- 9.3 Europe
- 9.3.1 Germany
- 9.3.2 UK
- 9.3.3 France
- 9.3.4 Italy
- 9.3.5 Spain
- 9.4 Asia Pacific
- 9.4.1 China
- 9.4.2 Japan
- 9.4.3 India
- 9.4.4 Australia
- 9.4.5 South Korea
- 9.5 Latin America
- 9.5.1 Brazil
- 9.5.2 Mexico
- 9.5.3 Argentina
- 9.6 Middle East and Africa
- 9.6.1 South Africa
- 9.6.2 Saudi Arabia
- 9.6.3 UAE
Chapter 10 Company Profiles
- 10.1 Binder+Co
- 10.2 Buhler Group
- 10.3 Comex
- 10.4 Eriez Manufacturing
- 10.5 FLSmidth
- 10.6 HPY Sorting Technology
- 10.7 Metso
- 10.8 MineSense Technologies
- 10.9 NextOre
- 10.10 Pellenc ST
- 10.11 REDWAVE
- 10.12 Scantech
- 10.13 Sesotec
- 10.14 STEINERT
- 10.15 TOMRA Systems

