
PUBLISHER: Global Market Insights Inc. | PRODUCT CODE: 1773259

PUBLISHER: Global Market Insights Inc. | PRODUCT CODE: 1773259
Powered Mobility Devices Market Opportunity, Growth Drivers, Industry Trend Analysis, and Forecast 2025 - 2034
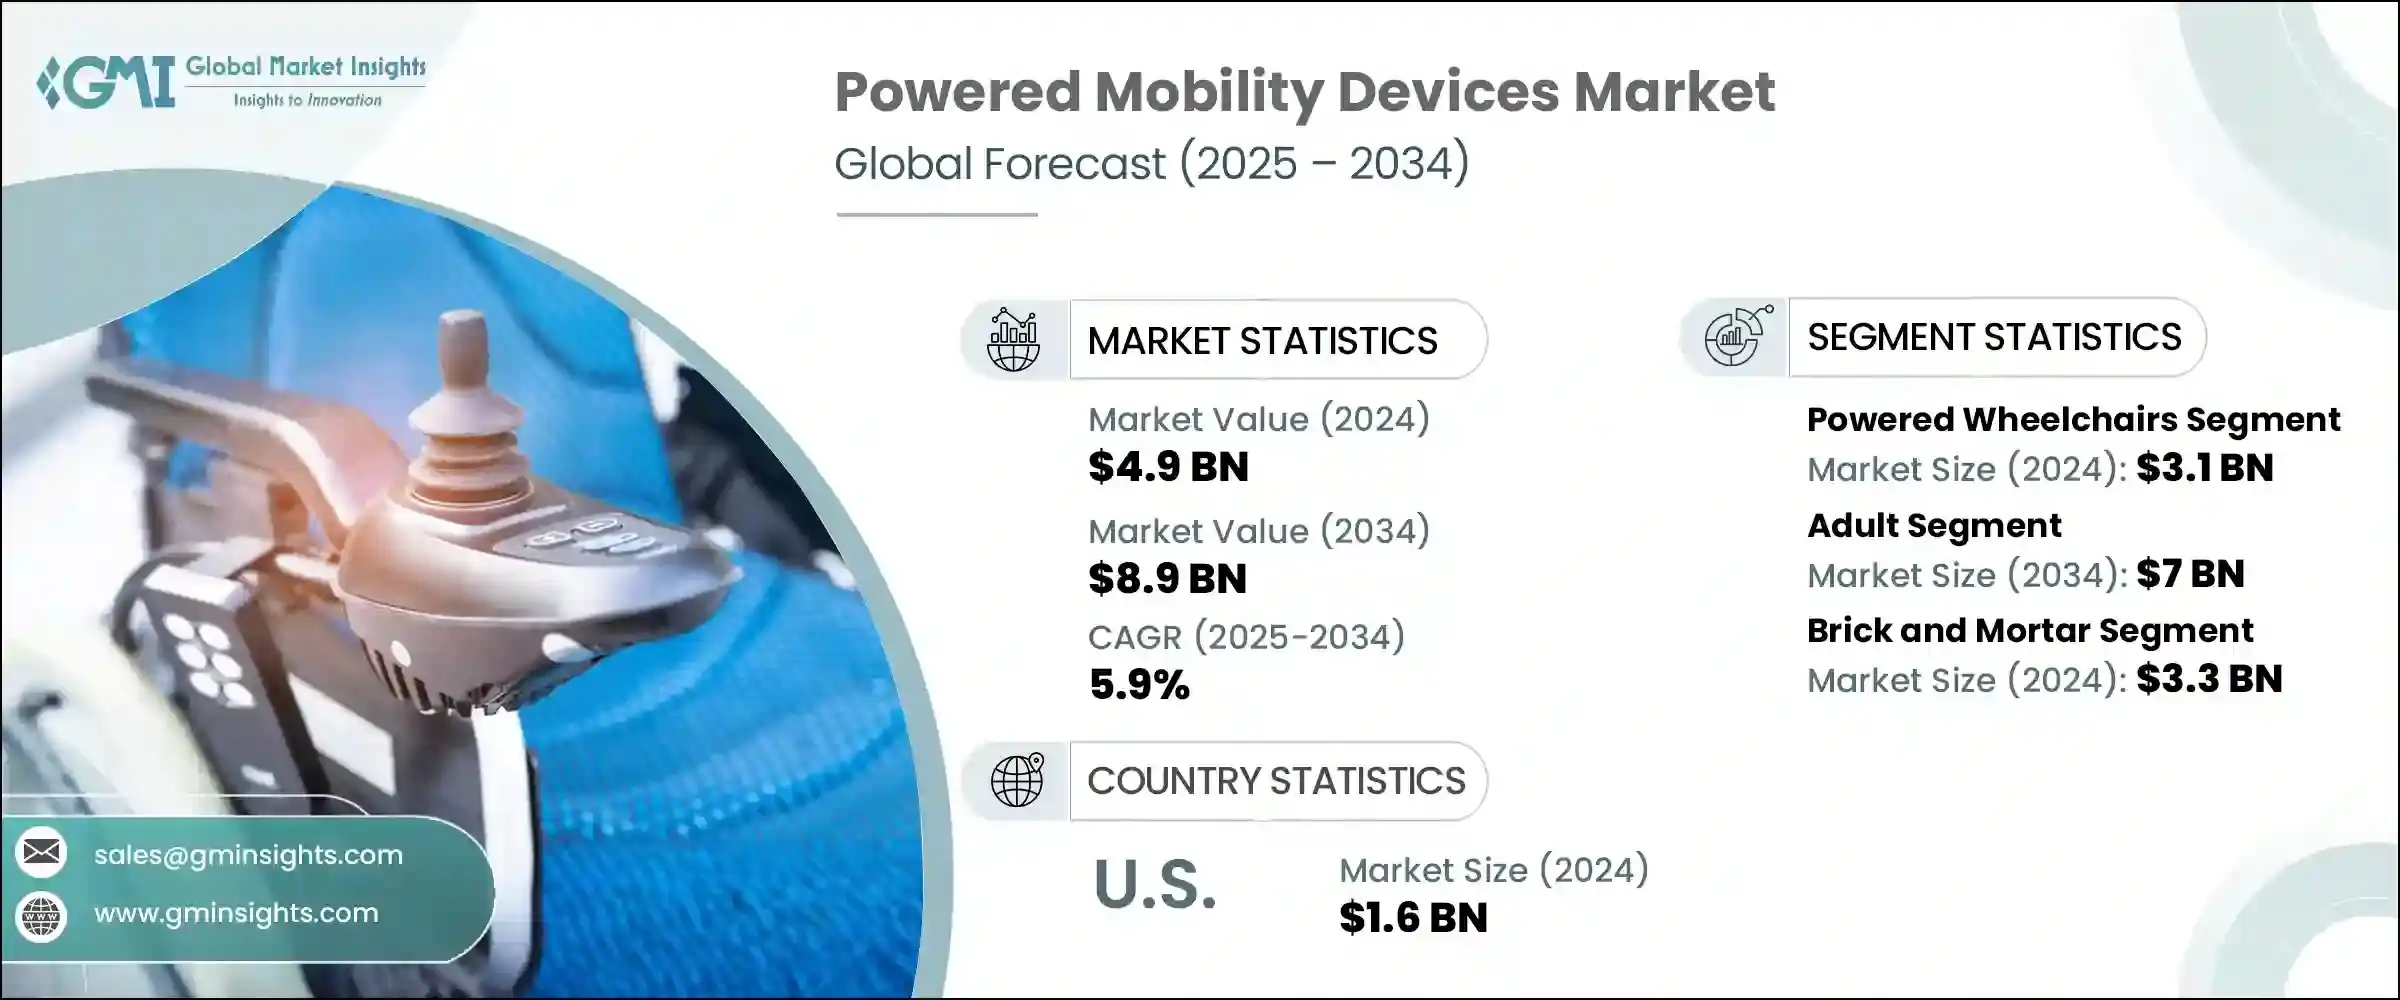
The Global Powered Mobility Devices Market was valued at USD 4.9 billion in 2024 and is estimated to grow at a CAGR of 5.9% to reach USD 8.9 billion by 2034. This surge is due to rising global disability rates, increased prevalence of neurological conditions, and rapid technological progress in mobility aids. Battery-powered mobility solutions offer independence where manual movement is challenging or impossible, significantly enhancing quality of life. The introduction of smart wheelchairs with sensors and cameras marks a pivotal advancement, enabling users-especially those with neurological challenges-to navigate environments safely with real-time feedback. These intelligent devices not only boost mobility but also support healthcare providers with valuable behavior insights. The convergence of unmet medical needs, rapid technological advancements, and evolving demographic patterns clearly explains why powered mobility devices are becoming indispensable in healthcare and personal independence.
These devices lead the way in overcoming mobility barriers by integrating cutting-edge technology that prioritizes user safety and independence. Equipped with advanced sensors, intuitive controls, and AI-powered navigation, they offer smarter, more responsive operations tailored to individual needs. Autonomous features reduce the reliance on caregivers, allowing users greater freedom to move confidently in various environments. By combining innovation with ergonomic design, these mobility aids not only enhance physical accessibility but also improve overall quality of life, fostering social inclusion and emotional well-being. As technology continues to evolve, powered mobility devices are becoming more adaptive, reliable, and user-friendly, setting new standards in personalized mobility support.
| Market Scope | |
|---|---|
| Start Year | 2024 |
| Forecast Year | 2025-2034 |
| Start Value | $4.9 Billion |
| Forecast Value | $8.9 Billion |
| CAGR | 5.9% |
The powered wheelchair segment led the market in 2024, reaching USD 3.1 billion, by providing seamless, effortless movement both indoors and outdoors. With diverse options such as independent drive, standing wheelchairs, and portable units, users benefit from highly customizable features like adjustable cushions, ergonomic backrests, and advanced tilt-in-space mechanisms-enhancements that not only improve comfort but also support rehabilitation and reduce secondary health issues.
The adult population segment is expected to reach USD 7 billion by 2034, especially seniors form the largest base of users. The increasing prevalence of disabilities within this demographic is a significant growth driver. Powered mobility devices play a vital role in simplifying everyday tasks, enhancing user autonomy, and minimizing fatigue-benefits that are crucial for older adults, nearly 40% of whom face mobility limitations.
United States Powered Mobility Devices Market was valued at USD 1.6 billion in 2024, supported by a rise in neurological conditions, spinal cord injuries, and an aging population. Favorable reimbursement policies combined with higher disposable incomes have accelerated the adoption of premium electric wheelchairs and mobility scooters, further strengthening the market's growth momentum.
Leading brands in the Global Powered Mobility Devices Market include PRIDE MOBILITY, GOLDEN, Drive DeVilbiss Healthcare, KARMAN, INVACARE, Hoveround Mobility Solutions, Airwheel, Decon Mobility, MEYRA, Permobil, Ottobock, OSTRICH, Merits, LEVO, and Frido. These companies are reshuffling innovation, funding, and design to meet user demands. Leading manufacturers are differentiating through R&D of intelligent features-integrating sensors, IoT connectivity, and AI-driven navigation-to offer safer, data-enriched mobility solutions..
They are expanding portfolios with modular designs-swappable drive units, adjustable seating, and standing mechanisms-to accommodate a wider range of users and conditions. Firms are forging partnerships with healthcare providers and payers to reduce cost barriers and improve reimbursement pathways, while targeted marketing addresses seniors and individuals with neurological disabilities. Strategic acquisitions of niche innovators, along with joint ventures, help companies tap new technologies and geographic markets.
Table of Contents
Chapter 1 Methodology and Scope
- 1.1 Market scope and definitions
- 1.2 Research design
- 1.2.1 Research approach
- 1.2.2 Data collection methods
- 1.3 Data mining sources
- 1.3.1 Global
- 1.3.2 Regional/Country
- 1.4 Base estimates and calculations
- 1.4.1 Base year calculation
- 1.4.2 Key trends for market estimation
- 1.5 Primary research and validation
- 1.5.1 Primary sources
- 1.6 Forecast model
- 1.7 Research assumptions and limitations
Chapter 2 Executive Summary
- 2.1 Industry 3600 synopsis
- 2.2 Key market trends
- 2.2.1 Regional
- 2.2.2 Product type
- 2.2.3 Patient
- 2.2.4 Distribution channel
- 2.2.5 End use
- 2.3 CXO perspectives: Strategic imperatives
- 2.3.1 Key decision points for industry executives
- 2.3.2 Critical success factors for market players
- 2.4 Future outlook and strategic recommendations
Chapter 3 Industry Insights
- 3.1 Industry ecosystem analysis
- 3.1.1 Supplier landscape
- 3.1.2 Value addition at each stage
- 3.1.3 Factor affecting the value chain
- 3.2 Industry impact forces
- 3.2.1 Growth drivers
- 3.2.1.1 Growing prevalence of neurological diseases
- 3.2.1.2 Technological advancements in powered mobility products
- 3.2.1.3 Rising percentage of geriatric population
- 3.2.1.4 Increasing prevalence of disabilities worldwide
- 3.2.2 Industry pitfalls and challenges
- 3.2.2.1 High cost of powered wheelchairs
- 3.2.2.2 Stringent regulatory framework
- 3.2.3 Opportunities
- 3.2.3.1 Focus on lightweight and foldable electric wheelchairs
- 3.2.1 Growth drivers
- 3.3 Growth potential analysis
- 3.4 Regulatory landscape
- 3.4.1 North America
- 3.4.2 Europe
- 3.5 Technology and innovation landscape
- 3.5.1 Current technological trends
- 3.5.2 Emerging technologies
- 3.6 Price trends, by product type
- 3.7 Future market trends
- 3.8 Reimbursement scenario
- 3.9 Consumer behaviour analysis
- 3.10 Gap analysis
- 3.11 Porter's analysis
- 3.12 PESTEL analysis
Chapter 4 Competitive Landscape, 2024
- 4.1 Introduction
- 4.2 Company market share analysis
- 4.2.1 Global
- 4.2.2 North America
- 4.2.3 Europe
- 4.2.4 Rest of the world
- 4.3 Company matrix analysis
- 4.4 Competitive analysis of major market players
- 4.5 Competitive positioning matrix
- 4.6 Key developments
- 4.6.1 Mergers and acquisitions
- 4.6.2 Partnerships and collaborations
- 4.6.3 New product launches
- 4.6.4 Expansion plans
Chapter 5 Market Estimates and Forecast, By Product Type, 2021 - 2034 ($ Mn)
- 5.1 Key trends
- 5.2 Powered wheelchairs
- 5.2.1 Rear wheel
- 5.2.2 Mid-wheel
- 5.2.3 Front wheel
- 5.2.4 Other types
- 5.3 Power operated vehicles
- 5.3.1 3-wheel devices
- 5.3.2 4-wheel devices
- 5.3.3 5-wheel devices
- 5.4 Power add-on or propulsion-assist units
Chapter 6 Market Estimates and Forecast, By Patient, 2021 - 2034 ($ Mn)
- 6.1 Key trends
- 6.2 Adult
- 6.3 Pediatric
Chapter 7 Market Estimates and Forecast, By Distribution Channel, 2021 - 2034 ($ Mn)
- 7.1 Key trends
- 7.2 Brick and mortar
- 7.3 Online channel
Chapter 8 Market Estimates and Forecast, By End Use, 2021 - 2034 ($ Mn)
- 8.1 Key trends
- 8.2 Home care
- 8.3 Rehabilitation centers
- 8.4 Hospitals
- 8.5 Other end use
Chapter 9 Market Estimates and Forecast, By Region, 2021 - 2034 ($ Mn)
- 9.1 Key trends
- 9.2 North America
- 9.2.1 U.S.
- 9.2.2 Canada
- 9.3 Europe
- 9.3.1 Germany
- 9.3.2 UK
- 9.3.3 France
- 9.3.4 Spain
- 9.3.5 Italy
- 9.3.6 Netherlands
- 9.4 Asia Pacific
- 9.4.1 China
- 9.4.2 Japan
- 9.4.3 India
- 9.4.4 Australia
- 9.4.5 South Korea
- 9.5 Latin America
- 9.5.1 Brazil
- 9.5.2 Mexico
- 9.5.3 Argentina
- 9.6 Middle East and Africa
- 9.6.1 South Africa
- 9.6.2 Saudi Arabia
- 9.6.3 UAE
Chapter 10 Company Profiles
- 10.1 Airwheel
- 10.2 decon
- 10.3 drive DeVilbiss Healthcare
- 10.4 Frido
- 10.5 GOLDEN
- 10.6 Hoveround Mobility Solutions
- 10.7 INVACARE
- 10.8 KARMAN
- 10.9 LEVO
- 10.10 merits
- 10.11 MEYRA
- 10.12 OSTRICH
- 10.13 ottobock
- 10.14 permobil
- 10.15 PRIDE MOBILITY

