
PUBLISHER: Global Market Insights Inc. | PRODUCT CODE: 1666899

PUBLISHER: Global Market Insights Inc. | PRODUCT CODE: 1666899
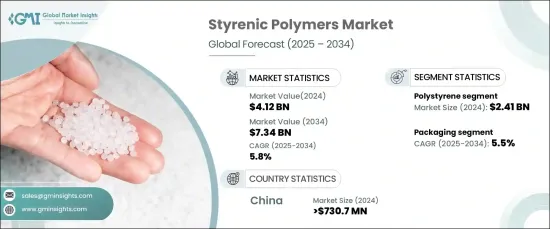
Styrenic Polymers Market Opportunity, Growth Drivers, Industry Trend Analysis, and Forecast 2025 - 2034
The Global Styrenic Polymers Market was valued at USD 4.12 billion in 2024 and is projected to grow at a CAGR of 5.8% between 2025 and 2034. These polymers, derived from styrene, are an essential group of cost-effective plastics known for their versatility. Their amorphous structure allows them to be easily processed at high temperatures, surpassing their softening point, which makes them easier to handle compared to other semi-crystalline polymers. Unlike others, styrenic polymers don't have a clear melting point, offering faster processing times and enhanced mechanical properties.
Styrenic polymers are used in a wide variety of industries, including packaging, consumer goods, electronics, automotive parts, and even boats. These polymers are prized for their ability to create lightweight, durable products ideal for many applications, particularly in packaging, where they provide excellent molding properties. Their widespread use is also attributed to their affordability and adaptability, making them indispensable in sectors like healthcare, sports, leisure, and personal care.
| Market Scope | |
|---|---|
| Start Year | 2024 |
| Forecast Year | 2025-2034 |
| Start Value | $4.12 Billion |
| Forecast Value | $7.34 Billion |
| CAGR | 5.8% |
The automotive and transportation sectors particularly benefit from the use of styrenic polymers due to their lightweight and durable nature, which contributes to improved fuel efficiency and overall performance. In building and construction, these materials are integral for insulation, piping, and other structural components. Their versatility has ensured a constant global demand across various industries.
However, environmental concerns related to the biodegradability of certain styrenic polymers, particularly in the case of polystyrene, present significant challenges for the market. This has led to stricter regulatory pressures and a shift in consumer preferences toward more sustainable alternatives. Manufacturers are now grappling with the need to meet evolving regulations, which could potentially slow market growth.
In 2024, polystyrene held the largest share of the styrenic polymers market, valued at USD 2.41 billion, with a projected CAGR of 5.4% during the forecast period. This rigid and versatile polymer is favored for its low cost and ease of processing, making it popular in packaging and other industries that require high-quality, cost-efficient materials.
Packaging remains the largest end-use segment of the styrenic polymers market, valued at USD 1.25 billion in 2024. This market is set to grow at a CAGR of 5.5% during the forecast period as the demand for versatile packaging materials continues to rise. Styrenic polymers are highly regarded for their strength, moldability, and transparency, which makes them the material of choice for diverse packaging applications.
The Asia-Pacific region, particularly China, is experiencing robust growth in the styrenic polymers market, with a valuation surpassing USD 730.7 million in 2024. The rapid pace of industrialization and urbanization, coupled with a growing middle class, is driving demand for consumer goods, packaging, and construction materials. The region's flourishing automotive sector is also a significant factor contributing to this growth, as styrenic polymers are widely used in various automotive components.
Table of Contents
Chapter 1 Methodology & Scope
- 1.1 Market scope & definition
- 1.2 Base estimates & calculations
- 1.3 Forecast calculation
- 1.4 Data sources
- 1.4.1 Primary
- 1.4.2 Secondary
- 1.4.2.1 Paid sources
- 1.4.2.2 Public sources
Chapter 2 Executive Summary
- 2.1 Industry synopsis, 2021-2034
Chapter 3 Industry Insights
- 3.1 Industry ecosystem analysis
- 3.1.1 Factor affecting the value chain
- 3.1.2 Profit margin analysis
- 3.1.3 Disruptions
- 3.1.4 Future outlook
- 3.1.5 Manufacturers
- 3.1.6 Distributors
- 3.2 Supplier landscape
- 3.3 Profit margin analysis
- 3.4 Key news & initiatives
- 3.5 Regulatory landscape
- 3.6 Impact forces
- 3.6.1 Growth drivers
- 3.6.1.1 Increasing demand for lightweight and sustainable materials
- 3.6.1.2 Rising consumer goods and packaging demands
- 3.6.2 Industry pitfalls & challenges
- 3.6.2.1 Environmental concerns and regulatory pressures
- 3.6.1 Growth drivers
- 3.7 Growth potential analysis
- 3.8 Porter’s analysis
- 3.9 PESTEL analysis
Chapter 4 Competitive Landscape, 2024
- 4.1 Introduction
- 4.2 Company market share analysis
- 4.3 Competitive positioning matrix
- 4.4 Strategic outlook matrix
Chapter 5 Market Size and Forecast, By Product, 2021-2034 (USD Million) (Kilo Tons)
- 5.1 Key trends
- 5.2 Polystyrene
- 5.3 ABS
- 5.4 SAN
- 5.5 MBS
- 5.6 MABS
- 5.7 SMMA
- 5.8 SBS
- 5.9 SEBS
- 5.10 Others
Chapter 6 Market Size and Forecast, By End Use, 2021-2034 (USD Million) (Kilo Tons)
- 6.1 Key trends
- 6.2 Automotive & transportation
- 6.3 Building & construction
- 6.4 Packaging
- 6.5 Consumer goods
- 6.6 Medical
- 6.7 Sports & leisure
- 6.8 Personal care
Chapter 7 Market Size and Forecast, By Region, 2021-2034 (USD Million) (Kilo Tons)
- 7.1 Key trends
- 7.2 North America
- 7.2.1 U.S.
- 7.2.2 Canada
- 7.3 Europe
- 7.3.1 UK
- 7.3.2 Germany
- 7.3.3 France
- 7.3.4 Italy
- 7.3.5 Spain
- 7.3.6 Russia
- 7.4 Asia Pacific
- 7.4.1 China
- 7.4.2 India
- 7.4.3 Japan
- 7.4.4 South Korea
- 7.4.5 Australia
- 7.5 Latin America
- 7.5.1 Brazil
- 7.5.2 Mexico
- 7.6 MEA
- 7.6.1 South Africa
- 7.6.2 Saudi Arabia
- 7.6.3 UAE
Chapter 8 Company Profiles
- 8.1 Asahi Kasei Corporation
- 8.2 BASF
- 8.3 China Petroleum & Chemical Corporation (Sinopec)
- 8.4 Dow Chemical Company
- 8.5 INEOS Styrolution Group
- 8.6 LG Chem
- 8.7 PTT Global Chemical Public Company Limited
- 8.8 Sumitomo Chemical Company, Limited
- 8.9 Trinseo

