
PUBLISHER: Global Market Insights Inc. | PRODUCT CODE: 1721619

PUBLISHER: Global Market Insights Inc. | PRODUCT CODE: 1721619
Passenger Ferries Market Opportunity, Growth Drivers, Industry Trend Analysis, and Forecast 2025 - 2034
The Global Passenger Ferries Market was valued at USD 15.3 billion in 2024 and is estimated to grow at a CAGR of 6.2% to reach USD 27.2 billion by 2034. This upward trend stems from the increasing demand for efficient and flexible transport options in densely populated and geographically scattered regions. Passenger ferries offer seamless connectivity between island territories, coastal cities, and isolated communities that often lack robust land transport infrastructure. Their ability to facilitate both human and cargo movement has encouraged rising investments from both public and private sectors. Governments and ferry operators are prioritizing projects that support tourism, regional connectivity, and sustainable transport solutions. The push toward green mobility, especially through electric and hybrid ferry models, is unlocking new opportunities for long-term growth across the maritime transport sector.
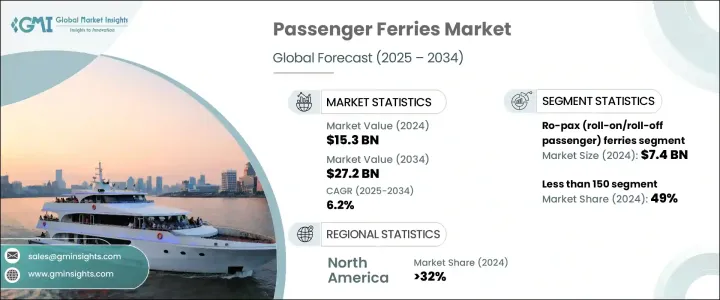
Among the key segments by ferry type, Ro-Pax (roll-on/roll-off passenger) ferries dominated the market with a value of USD 7.4 billion in 2024. These vessels allow passengers and vehicles to travel simultaneously, making them ideal for routes with limited road access. The capability to handle both travelers and rolling cargo in a single trip supports tourism and trade. Operators are steadily expanding their fleets and upgrading ports to boost coverage across high-traffic maritime corridors. The growing preference for travel methods that support personal vehicle transport at tourist spots is further driving adoption. Ro-Pax ferries combine comfort with utility, making them a favored choice for weekend travelers and logistics operators alike. Efforts to modernize these vessels with fuel-efficient engines, hybrid propulsion systems, and aerodynamic hulls are driving down operational costs while aligning with environmental regulations. This shift is also attracting eco-conscious consumers and commercial clients, with green financing playing a pivotal role in fleet modernization initiatives worldwide.
| Market Scope | |
|---|---|
| Start Year | 2024 |
| Forecast Year | 2025-2034 |
| Start Value | $15.3 Billion |
| Forecast Value | $27.2 Billion |
| CAGR | 6.2% |
By capacity, ferries accommodating fewer than 150 passengers accounted for 49% of the market share in 2024. These compact vessels serve urban waterfronts and narrow inland waterways where larger ferries cannot operate efficiently. Their smaller size makes them suitable for quick turnaround operations, appealing to city commuters and local tourists. As urban areas explore water-based transport to reduce road congestion, small-capacity ferries are being adopted as cost-effective, fuel-efficient alternatives. The demand for these ferries is further supported by innovations such as electric propulsion systems, lightweight construction materials, and automated onboard technology. This makes them viable for frequent short-distance operations while keeping maintenance costs low and reducing emissions.
In terms of technology, diesel-powered ferries continued to dominate in 2024, largely due to their reliability and established infrastructure. They remain a preferred option across long-distance and high-load routes, especially in regions where advanced energy alternatives are still emerging. Diesel ferries offer operational advantages such as longer range and minimal refueling needs, making them ideal for extended trips in challenging marine environments. Despite the shift toward cleaner technologies, many operators continue to rely on diesel vessels for their durability, easy maintenance, and cost-effectiveness.
North America held the largest regional market share at over 32% in 2024, with the United States leading the regional expansion through strategic investments in ferry infrastructure and cleaner maritime transport systems.
Leading companies in the passenger ferries market-such as BC Ferries, Stena Line, and Brittany Ferries-are driving growth through green technology and fleet electrification. These players are investing in hybrid propulsion systems and alternative fuels to meet evolving environmental regulations. To enhance customer experience and operational efficiency, operators are expanding route networks, upgrading onboard amenities, and adopting digital ticketing and real-time tracking technologies. Collaborations with port authorities and access to government funding further support their efforts to scale operations and maintain service quality. In this competitive and fragmented industry, innovation and sustainability remain key strategies for long-term success and regional expansion.
Table of Contents
Chapter 1 Methodology & Scope
- 1.1 Research design
- 1.1.1 Research approach
- 1.1.2 Data collection methods
- 1.2 Base estimates and calculations
- 1.2.1 Base year calculation
- 1.2.2 Key trends for market estimates
- 1.3 Forecast model
- 1.4 Primary research & validation
- 1.4.1 Primary sources
- 1.4.2 Data mining sources
- 1.5 Market definitions
Chapter 2 Executive Summary
- 2.1 Industry 3600 synopsis, 2021 - 2034
Chapter 3 Industry Insights
- 3.1 Industry ecosystem analysis
- 3.2 Supplier landscape
- 3.2.1 Manufacturers
- 3.2.2 Service provider
- 3.2.3 Technology provider
- 3.2.4 End use
- 3.3 Impact of trump administration tariffs
- 3.3.1 Impact on trade
- 3.3.1.1 Trade volume disruptions
- 3.3.1.2 Retaliatory measures
- 3.3.2 Impact on the Industry
- 3.3.2.1 Price volatility in key materials
- 3.3.2.1.1 Supply chain restructuring
- 3.3.2.1.2 Price transmission to end markets
- 3.3.2.1 Price volatility in key materials
- 3.3.3 Strategic industry responses
- 3.3.3.1 Supply chain reconfiguration
- 3.3.3.2 Pricing and product strategies
- 3.3.1 Impact on trade
- 3.4 Profit margin analysis
- 3.5 Cost breakdown analysis
- 3.6 Technology & innovation landscape
- 3.7 Key news & initiatives
- 3.8 Regulatory landscape
- 3.9 Impact forces
- 3.9.1 Growth drivers
- 3.9.1.1 Urban integration of water-based transit solutions
- 3.9.1.2 Expansion of maritime tourism and leisure travel
- 3.9.1.3 Government support for sustainable marine transport
- 3.9.1.4 Technological advancements in ferry design and efficiency
- 3.9.2 Industry pitfalls & challenges
- 3.9.2.1 High operating costs and fuel dependency
- 3.9.2.2 Seasonal demand fluctuations and route viability issues
- 3.9.1 Growth drivers
- 3.10 Growth potential analysis
- 3.11 Porter’s analysis
- 3.12 PESTEL analysis
Chapter 4 Competitive Landscape, 2024
- 4.1 Introduction
- 4.2 Company market share analysis
- 4.3 Competitive positioning matrix
- 4.4 Strategic outlook matrix
Chapter 5 Market Estimates & Forecast, By Ferry, 2021 - 2034 ($Mn & Fleet Size)
- 5.1 Key trends
- 5.2 Ro-pax (roll-on/roll-off passenger) ferries
- 5.3 High-speed ferries
- 5.4 Cruise ferries
Chapter 6 Market Estimates & Forecast, By Capacity, 2021 - 2034 ($Mn & Fleet Size)
- 6.1 Key trends
- 6.2 Less than 150
- 6.3 150 - 400
- 6.4 More than 400
Chapter 7 Market Estimates & Forecast, By Vehicle, 2021 - 2034 ($Mn & Fleet Size)
- 7.1 Key trends
- 7.2 Conventional diesel-powered ferries
- 7.3 Electric & hybrid ferries
- 7.4 LNG powered ferries
Chapter 8 Market Estimates & Forecast, By Region, 2021 - 2034 ($Mn & Fleet Size)
- 8.1 Key trends
- 8.2 North America
- 8.2.1 U.S.
- 8.2.2 Canada
- 8.3 Europe
- 8.3.1 UK
- 8.3.2 Germany
- 8.3.3 France
- 8.3.4 Spain
- 8.3.5 Italy
- 8.3.6 Russia
- 8.3.7 Nordics
- 8.4 Asia Pacific
- 8.4.1 China
- 8.4.2 India
- 8.4.3 Japan
- 8.4.4 South Korea
- 8.4.5 Australia
- 8.4.6 Southeast Asia
- 8.5 Latin America
- 8.5.1 Brazil
- 8.5.2 Argentina
- 8.5.3 Mexico
- 8.6 MEA
- 8.6.1 UAE
- 8.6.2 South Africa
- 8.6.3 Saudi Arabia
Chapter 9 Company Profiles
- 9.1 Austal
- 9.2 BC Ferries
- 9.3 Blue Star Ferries
- 9.4 Brittany Ferries
- 9.5 Corsica Ferries
- 9.6 Damen Shipyards Group
- 9.7 DFDS Seaways
- 9.8 Fjord1 ASA
- 9.9 Grimaldi Lines
- 9.10 Hornblower Cruises & Events
- 9.11 Incat
- 9.12 Irish Ferries
- 9.13 Jadrolinija
- 9.14 Meyer Werft
- 9.15 Minoan Lines
- 9.16 NY Waterway
- 9.17 P&O Ferries
- 9.18 Stena Line
- 9.19 Tallink Grupp
- 9.20 Washington State Ferries

