
PUBLISHER: Global Market Insights Inc. | PRODUCT CODE: 1871290

PUBLISHER: Global Market Insights Inc. | PRODUCT CODE: 1871290
Winch Market Opportunity, Growth Drivers, Industry Trend Analysis, and Forecast 2025 - 2034
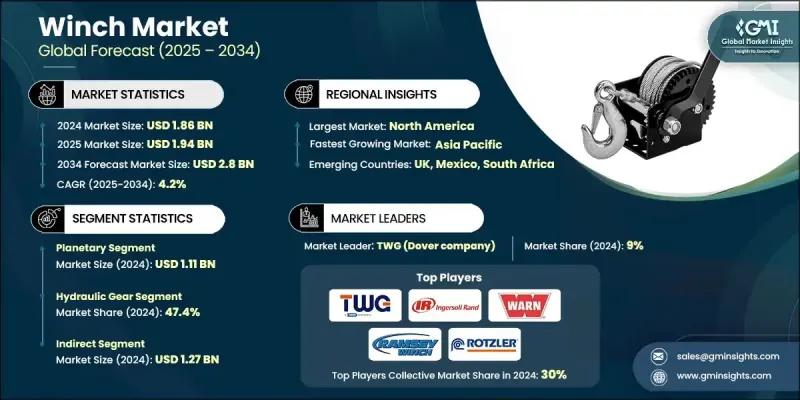
The Global Winch Market was valued at USD 1.86 billion in 2024 and is estimated to grow at a CAGR of 4.2% to reach USD 2.8 billion by 2034.
Urban expansion and industrial growth are the primary forces driving demand in this market. As cities evolve and infrastructure projects multiply, the need for efficient material handling solutions rises, with winches playing a critical role in lifting heavy loads, moving structural components, and supporting underground construction and pipeline installation. Large-scale urban development initiatives and smart city projects, particularly in emerging economies, are creating demand for versatile, high-capacity winch systems that can perform reliably across varied conditions. Industrialization is equally important, as manufacturing plants, warehouses, and logistics operations increasingly adopt mechanized solutions to replace manual labor, enhance safety, and optimize operational efficiency. Integration of winches into automated assembly lines, cargo handling systems, and equipment maintenance workflows is driving consistent demand across sectors such as automotive, chemicals, steel, and heavy machinery, ensuring a sustained market outlook.
| Market Scope | |
|---|---|
| Start Year | 2024 |
| Forecast Year | 2025-2034 |
| Start Value | $1.86 Billion |
| Forecast Value | $2.8 Billion |
| CAGR | 4.2% |
The planetary gear winch segment generated USD 1.11 billion in 2024. Planetary gear winches are valued for their ability to deliver high torque in compact designs, making them suitable for heavy-duty applications. By distributing load over multiple gear contacts, these systems provide smooth operation, efficient load management, and reduced mechanical complexity. Their consistent power transfer under varying loads makes them ideal for applications demanding precision and reliability, including industrial hoisting, marine operations, and equipment recovery.
The hydraulic gear winches segment held a 47.4% share in 2024. Hydraulic winches are preferred for their ability to maintain steady torque and power over extended periods, making them reliable for industrial and commercial usage. Unlike electric alternatives, which can overheat or lose efficiency during prolonged use, hydraulic systems perform consistently in extreme conditions such as heat, moisture, dirt, and corrosion. Their rugged design, reinforced seals, and solid construction enable deployment in challenging environments, including marine, mining, and offshore operations.
U.S. Winch Market held 75.6% share and generated USD 530 million in 2024. The country's robust industrial base, combined with continuous investment in infrastructure modernization, drives steady demand for winches across construction, marine, defense, and oil & gas applications. Winches remain integral to lifting and pulling heavy materials, and ongoing urbanization, energy infrastructure development, and transportation upgrades further reinforce market growth.
Key players operating in the Global Winch Market include Warn Industries, Lewmar, Superwinch, Rotzler, ACE Winches, Dutton-Lainson Company, Transvictory Winch System, PALFINGER MARINE, Ramsey Winch, TWG (Dover Company), Ingersoll Rand, Columbus McKinnon, and COMEUP Industries. Companies in the Winch Market are adopting multiple strategies to strengthen their presence and expand market share. They are investing in research and development to enhance product efficiency, durability, and adaptability for diverse industrial applications. Product portfolio expansion, including specialized and high-capacity winches, helps address the requirements of multiple end-use sectors. Strategic collaborations with distributors, contractors, and rental service providers enable broader market access and faster adoption.
Table of Contents
Chapter 1 Methodology and Scope
- 1.1 Market scope and definition
- 1.2 Research design
- 1.2.1 Research approach
- 1.2.2 Data collection methods
- 1.3 Data mining sources
- 1.3.1 Global
- 1.3.2 Regional/Country
- 1.4 Base estimates and calculations
- 1.4.1 Base year calculation
- 1.4.2 Key trends for market estimation
- 1.5 Primary research and validation
- 1.5.1 Primary sources
- 1.6 Forecast model
- 1.7 Research assumptions and limitations
Chapter 2 Executive Summary
- 2.1 Industry 3600 synopsis
- 2.2 Key market trends
- 2.2.1 Regional
- 2.2.2 Product type
- 2.2.3 Operation
- 2.2.4 Pulling capacity
- 2.2.5 Application
- 2.2.6 End use industry
- 2.2.7 Distribution channel
- 2.3 CXO perspectives: strategic imperatives
- 2.3.1 Key decision points for industry executives
- 2.3.2 Critical success factors for market players
- 2.4 Future outlook and strategic recommendations
Chapter 3 Industry Insights
- 3.1 Industry ecosystem analysis
- 3.1.1 Supplier landscape
- 3.1.2 Profit margin
- 3.1.3 Value addition at each stage
- 3.1.4 Factor affecting the value chain
- 3.2 Industry impact forces
- 3.2.1 Growth drivers
- 3.2.1.1 Urbanization and industrialization
- 3.2.1.2 Rise in oil and gas exploration activities
- 3.2.1.3 Industrial mechanization and logistics
- 3.2.2 Industry pitfalls & challenges
- 3.2.2.1 High initial cost
- 3.2.2.2 Regulatory and safety compliance
- 3.2.3 Opportunities
- 3.2.3.1 Technological innovation and smart winches
- 3.2.3.2 Customization and modular design
- 3.2.1 Growth drivers
- 3.3 Growth potential analysis
- 3.4 Future market trends
- 3.5 Technology and innovation landscape
- 3.5.1 Current technological trends
- 3.5.2 Emerging technologies
- 3.6 Price trends
- 3.6.1 By region
- 3.6.2 By product type
- 3.7 Regulatory landscape
- 3.7.1 Standards and compliance requirements
- 3.7.2 Regional regulatory frameworks
- 3.7.3 Certification standards
- 3.8 Porter's analysis
- 3.9 PESTEL analysis
Chapter 4 Competitive Landscape, 2024
- 4.1 Introduction
- 4.2 Company market share analysis
- 4.2.1 By region
- 4.2.1.1 North America
- 4.2.1.2 Europe
- 4.2.1.3 Asia Pacific
- 4.2.1.4 Latin America
- 4.2.1.5 Middle East and Africa
- 4.2.1 By region
- 4.3 Company matrix analysis
- 4.4 Competitive analysis of major market players
- 4.5 Competitive positioning matrix
- 4.6 Key developments
- 4.6.1 Mergers & acquisitions
- 4.6.2 Partnerships & collaborations
- 4.6.3 New product launches
- 4.6.4 Expansion plans
Chapter 5 Market Estimates and Forecast, By Product Type, 2021 - 2034 (USD Billion) (Thousand Units)
- 5.1 Key trends
- 5.2 Planetary
- 5.3 Worm
Chapter 6 Market Estimates and Forecast, By Operation, 2021 - 2034 (USD Billion) (Thousand Units)
- 6.1 Key trends
- 6.2 Hydraulic
- 6.3 Electric
- 6.4 Pneumatic
- 6.5 Manual
Chapter 7 Market Estimates and Forecast, By Pulling Capacity, 2021 - 2034 (USD Billion) (Thousand Units)
- 7.1 Key trends
- 7.2 Below 2000 lbs.
- 7.3 2000 -4000 lbs.
- 7.4 4000 -8000 lbs.
- 7.5 8000 -12000 lbs.
- 7.6 12000 -16000 lbs.
- 7.7 16000 -20000 lbs.
- 7.8 20000 -40000 lbs.
- 7.9 40000 -80000 lbs.
- 7.10 Above 80000 lbs.
Chapter 8 Market Estimates and Forecast, By Application, 2021 - 2034 (USD Billion) (Thousand Units)
- 8.1 Key trends
- 8.2 Commercial recovery
- 8.3 Mobile crane
- 8.4 Military
- 8.5 Work boat
- 8.6 Utility
- 8.7 Others
Chapter 9 Market Estimates and Forecast, By End Use Industry, 2021 - 2034 (USD Billion) (Thousand Units)
- 9.1 Key trends
- 9.2 Oil & gas
- 9.3 Marine
- 9.4 Mining
- 9.5 Aerospace & defence
- 9.6 Automotive
- 9.7 Construction
- 9.8 Metal industry
- 9.9 Energy power
- 9.10 Transportation & material handling
- 9.11 Others
Chapter 10 Market Estimates and Forecast, By Distribution Channel, 2021 - 2034 (USD Billion) (Thousand Units)
- 10.1 Key trends
- 10.2 Direct
- 10.3 Indirect
Chapter 11 Market Estimates and Forecast, By Region, 2021 - 2034 (USD Billion) (Thousand Units)
- 11.1 Key trends
- 11.2 North America
- 11.2.1 U.S.
- 11.2.2 Canada
- 11.3 Europe
- 11.3.1 Germany
- 11.3.2 UK
- 11.3.3 France
- 11.3.4 Italy
- 11.3.5 Spain
- 11.4 Asia Pacific
- 11.4.1 China
- 11.4.2 Japan
- 11.4.3 India
- 11.4.4 Australia
- 11.4.5 South Korea
- 11.5 Latin America
- 11.5.1 Brazil
- 11.5.2 Mexico
- 11.5.3 Argentina
- 11.6 Middle East and Africa
- 11.6.1 South Africa
- 11.6.2 Saudi Arabia
- 11.6.3 UAE
Chapter 12 Company Profiles
- 12.1 ACE Winches
- 12.2 Columbus McKinnon
- 12.3 COMEUP Industries
- 12.4 Dutton-Lainson Company
- 12.5 Ingersoll Rand
- 12.6 Lewmar
- 12.7 PALFINGER MARINE
- 12.8 Ramsey Winch
- 12.9 Rotzler
- 12.10 Superwinch
- 12.11 Thern
- 12.12 Transvictory Winch System
- 12.13 TWG (Dover company)
- 12.14 Warn Industries
- 12.15 WPT Power Corporation

