
PUBLISHER: Global Market Insights Inc. | PRODUCT CODE: 1928976

PUBLISHER: Global Market Insights Inc. | PRODUCT CODE: 1928976
Interferometric Synthetic Aperture Radar (InSAR) Market Opportunity, Growth Drivers, Industry Trend Analysis, and Forecast 2026 - 2035
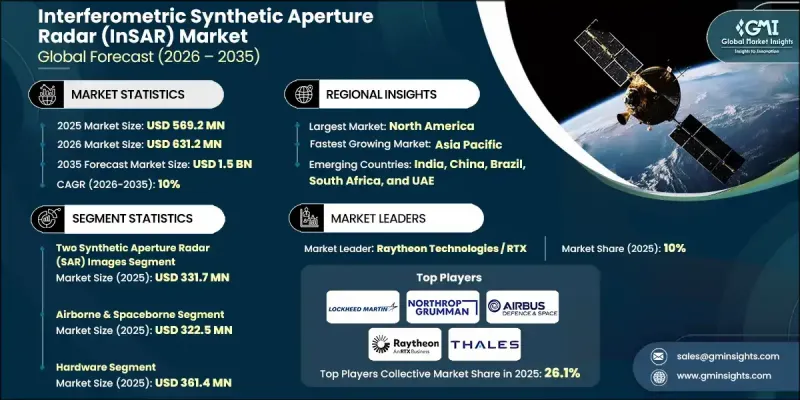
The Global Interferometric Synthetic Aperture Radar (InSAR) Market was valued at USD 569.2 million in 2025 and is estimated to grow at a CAGR of 10% to reach USD 1.5 billion by 2035.
The growth trajectory is driven by rising demand for high-precision surface monitoring, the convergence of radar data with artificial intelligence, machine learning, and cloud-based analytics, and expanding use across energy, natural resource, and public-sector space initiatives. The increasing deployment of satellite constellations with frequent revisit capabilities continues to enhance data availability and improve monitoring accuracy. Technology's ability to deliver consistent, large-area measurements regardless of weather or lighting conditions has elevated its importance for long-term planning, risk mitigation, and asset management. As analytical platforms mature, organizations increasingly rely on interferometric radar insights to support predictive modeling and operational decision-making. Government-backed observation programs and commercial adoption are reinforcing market scalability, while continuous innovation in processing techniques and platform integration is expanding accessibility across industries. These combined factors position interferometric synthetic aperture radar as a critical geospatial intelligence tool supporting infrastructure resilience, environmental oversight, and strategic planning worldwide.
| Market Scope | |
|---|---|
| Start Year | 2025 |
| Forecast Year | 2026-2035 |
| Start Value | $569.2 Million |
| Forecast Value | $1.5 Billion |
| CAGR | 10% |
Ongoing maintenance and monitoring applications are accelerating adoption due to the capability of interferometric radar to detect minute surface changes over time. Continuous observation supports proactive maintenance planning, lowers the probability of structural failures, reduces long-term repair costs, and strengthens disaster readiness strategies. In the energy and resource sectors, technology plays a growing role by enabling precise measurement of land movement around operational zones, supporting safety objectives, minimizing environmental exposure, and improving regulatory compliance. Large-scale monitoring reduces dependence on manual inspections while enhancing predictive maintenance and operational risk assessment.
The two-image synthetic aperture radar segment reached USD 331.7 million in 2025. This method remains widely adopted due to its lower implementation costs, reduced processing complexity, and reliable accuracy for deformation and stability assessments. For many users, the balance between resolution quality and streamlined workflows eliminates the need for more complex multi-image techniques.
The airborne and spaceborne platforms formed the leading deployment category, generating USD 322.5 million in 2025. These platforms support extensive geographic coverage and consistent observation cycles, making them essential for large-scale monitoring and national observation initiatives that require frequent data updates and broad visibility.
North America Interferometric Synthetic Aperture Radar (InSAR) Market accounted for 33.5% share in 2025, maintaining leadership through sustained investment in advanced analytics, space technologies, and monitoring solutions. Strong adoption across public agencies and commercial sectors has increased demand for high-resolution radar datasets and analytical services, reinforcing regional market strength.
Key companies active in the Global Interferometric Synthetic Aperture Radar (InSAR) Market include Airbus Defence and Space, ICEYE, Capella Space, Lockheed Martin Corporation, Northrop Grumman Corporation, Leonardo S.p.A., Thales Group, Raytheon Technologies, L3Harris Technologies, BAE Systems, MDA Ltd., Synspective, GAMMA Remote Sensing AG, CGG, GroundProbe, Orbital Insight, PCI Geomatics, SkyGeo, sarmap SA, Tre Altamira, Tele-Rilevamento Europa, and 3vGeomatics. Companies in the Global Interferometric Synthetic Aperture Radar (InSAR) Market strengthen their competitive position through continuous technology innovation, expansion of satellite and airborne capabilities, and integration of advanced analytics. Strategic investments in AI-driven data processing and cloud-based delivery platforms improve scalability and customer accessibility. Partnerships with government agencies, infrastructure operators, and energy companies help secure long-term contracts and recurring revenue streams.
Table of Contents
Chapter 1 Methodology and Scope
- 1.1 Market scope and definition
- 1.2 Research design
- 1.2.1 Research approach
- 1.2.2 Data collection methods
- 1.3 Data mining sources
- 1.3.1 Global
- 1.3.2 Regional/Country
- 1.4 Base estimates and calculations
- 1.4.1 Base year calculation
- 1.4.2 Key trends for market estimation
- 1.5 Primary research and validation
- 1.5.1 Primary sources
- 1.6 Forecast model
- 1.7 Research assumptions and limitations
Chapter 2 Executive Summary
- 2.1 Industry 360° synopsis
- 2.2 Key market trends
- 2.2.1 Type trends
- 2.2.2 Platform trends
- 2.2.3 Component trends
- 2.2.4 Application trends
- 2.2.5 End use trends
- 2.2.6 Regional trends
- 2.3 TAM Analysis, 2026-2035 (USD Million)
- 2.4 CXO perspectives: Strategic imperatives
- 2.4.1 Executive decision points
- 2.4.2 Critical success factors
- 2.5 Future outlook and strategic recommendations
Chapter 3 Industry Insights
- 3.1 Industry ecosystem analysis
- 3.1.1 Supplier landscape
- 3.1.2 Profit margin
- 3.1.3 Cost structure
- 3.1.4 Value addition at each stage
- 3.1.5 Factor affecting the value chain
- 3.1.6 Disruptions
- 3.2 Industry impact forces
- 3.2.1 Growth drivers
- 3.2.1.1 Infrastructure monitoring & maintenance
- 3.2.1.2 Integration with AI, ML, and cloud analytics
- 3.2.1.3 Oil, gas & mining applications
- 3.2.1.4 Defense & government space programs
- 3.2.1.5 Satellite constellations & high-frequency revisit
- 3.2.2 Pitfalls and challenges
- 3.2.2.1 High deployment & system costs
- 3.2.2.2 Technical complexity & skill requirements
- 3.2.3 Opportunities:
- 3.2.3.1 Infrastructure Resilience & Smart City Projects
- 3.2.3.2 Environmental Monitoring & Disaster Management
- 3.2.1 Growth drivers
- 3.3 Growth potential analysis
- 3.4 Regulatory landscape
- 3.4.1 North America
- 3.4.2 Europe
- 3.4.3 Asia Pacific
- 3.4.4 Latin America
- 3.4.5 Middle East & Africa
- 3.5 Porter';s analysis
- 3.6 PESTEL analysis
- 3.7 Technology and Innovation landscape
- 3.7.1 Current technological trends
- 3.7.2 Emerging technologies
- 3.8 Emerging Business Models
- 3.9 Compliance Requirements
- 3.10 Sustainability Initiatives
- 3.11 Supply Chain Resilience
- 3.12 Geopolitical Analysis
- 3.13 Digital Transformation
- 3.14 Mergers, Acquisitions, and Strategic Partnerships Landscape
Chapter 4 Competitive Landscape, 2025
- 4.1 Introduction
- 4.2 Company market share analysis
- 4.2.1 By region
- 4.2.1.1 North America
- 4.2.1.2 Europe
- 4.2.1.3 Asia Pacific
- 4.2.1.4 Latin America
- 4.2.1.5 Middle East & Africa
- 4.2.2 Market concentration analysis
- 4.2.1 By region
- 4.3 Competitive benchmarking of key players
- 4.3.1 Product portfolio comparison
- 4.3.1.1 Product range breadth
- 4.3.1.2 Technology
- 4.3.1.3 Innovation
- 4.3.2 Geographic presence comparison
- 4.3.2.1 Global footprint analysis
- 4.3.2.2 Service network coverage
- 4.3.2.3 Market penetration by region
- 4.3.3 Competitive positioning matrix
- 4.3.3.1 Leaders
- 4.3.3.2 Challengers
- 4.3.3.3 Followers
- 4.3.3.4 Niche players
- 4.3.4 Strategic outlook matrix
- 4.3.1 Product portfolio comparison
- 4.4 Key developments, 2022-2025
- 4.4.1 Mergers and acquisitions
- 4.4.2 Partnerships and collaborations
- 4.4.3 Technological advancements
- 4.4.4 Expansion and investment strategies
- 4.4.5 Sustainability initiatives
- 4.4.6 Digital transformation initiatives
- 4.5 Emerging/ startup competitors landscape
Chapter 5 Market Estimates and Forecast, By Type, 2022 - 2035 (USD Million)
- 5.1 Key trends
- 5.2 Two Synthetic Aperture Radar (SAR) Images
- 5.3 Multiple Synthetic Aperture Radar (SAR) Images
Chapter 6 Market Estimates and Forecast, By Platform, 2022 - 2035 (USD Million)
- 6.1 Key trends
- 6.2 Airborne & spaceborne
- 6.3 Ground-based
- 6.4 Others
Chapter 7 Market Estimates and Forecast, By Component, 2022 - 2035 (USD Million)
- 7.1 Key trends
- 7.2 Hardware
- 7.3 Software
- 7.4 Services
Chapter 8 Market Estimates and Forecast, By Application, 2022 - 2035 (USD Million)
- 8.1 Key trends
- 8.2 Navigation
- 8.3 Impact assessment
- 8.3.1 Flood and drought
- 8.3.2 Seismic hazard
- 8.3.3 Open-pit mine
- 8.3.4 Others
- 8.4 Monitoring
- 8.4.1 Subsidence & field
- 8.4.2 Infrastructure stability
- 8.4.3 Glacier and ice sheet
- 8.4.4 Volcanic activity
- 8.4.5 Others
- 8.5 Mapping & planning
- 8.6 Others
Chapter 9 Market Estimates and Forecast, By End use, 2022 - 2035 (USD Million)
- 9.1 Key trends
- 9.2 Aerospace & defense
- 9.3 Agriculture
- 9.4 Civil engineering & construction
- 9.5 Environmental monitoring
- 9.6 Mining
- 9.7 Oil & gas
- 9.8 Others
Chapter 10 Market Estimates and Forecast, By Region, 2022 - 2035 (USD Million)
- 10.1 Key trends
- 10.2 North America
- 10.2.1 U.S.
- 10.2.2 Canada
- 10.3 Europe
- 10.3.1 Germany
- 10.3.2 UK
- 10.3.3 France
- 10.3.4 Spain
- 10.3.5 Italy
- 10.3.6 Netherlands
- 10.4 Asia Pacific
- 10.4.1 China
- 10.4.2 India
- 10.4.3 Japan
- 10.4.4 Australia
- 10.4.5 South Korea
- 10.5 Latin America
- 10.5.1 Brazil
- 10.5.2 Mexico
- 10.5.3 Argentina
- 10.6 Middle East and Africa
- 10.6.1 Saudi Arabia
- 10.6.2 South Africa
- 10.6.3 UAE
Chapter 11 Company Profiles
- 11.1 Global Key Players
- 11.1.1 Airbus Defence and Space
- 11.1.2 Lockheed Martin Corporation
- 11.1.3 Northrop Grumman Corporation
- 11.1.4 Raytheon Technologies
- 11.1.5 Thales Group
- 11.1.6 BAE Systems
- 11.1.7 Leonardo S.p.A.
- 11.1.8. L3 Harris Technologies
- 11.2 Regional Key Players
- 11.2.1 North America
- 11.2.1.1 Capella Space
- 11.2.1.2 MDA Ltd.
- 11.2.1.3 Orbital Insight
- 11.2.1.4 SkyGeo
- 11.2.2 Europe
- 11.2.2.1 GAMMA Remote Sensing AG
- 11.2.2.2 CGG
- 11.2.2.3 Tre Altamira
- 11.2.2.4 Tele-Rilevamento Europa
- 11.2.2.5 sarmap SA
- 11.2.3 Asia Pacific
- 11.2.3.1 ICEYE
- 11.2.3.2 Synspective
- 11.2.1 North America
- 11.3 Niche / Disruptors
- 11.3.1 3vGeomatics
- 11.3.2 GroundProbe
- 11.3.3 PCI Geomatics

