
PUBLISHER: Global Market Insights Inc. | PRODUCT CODE: 1665109

PUBLISHER: Global Market Insights Inc. | PRODUCT CODE: 1665109
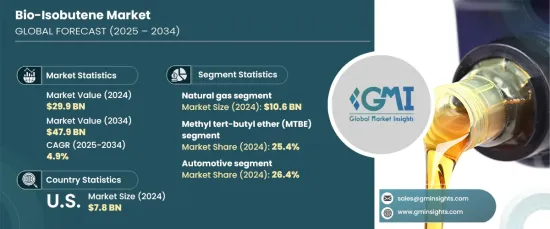
Bio-Isobutene Market Opportunity, Growth Drivers, Industry Trend Analysis, and Forecast 2024 - 2034
The Global Bio-Isobutene Market reached USD 29.9 billion in 2024 and is projected to expand at a CAGR of 4.9% between 2025 and 2034. The driving forces behind this market growth include the increasing demand for eco-friendly and renewable alternatives to traditional petrochemical products. As environmental concerns continue to mount, coupled with strict regulations aimed at reducing carbon emissions, the shift toward bio-based chemicals is gaining momentum. More industries are prioritizing sustainability, and bio-isobutene is at the forefront of this transformation. With its potential to replace harmful fossil fuels, bio-isobutene's adoption is accelerating across various sectors, including automotive, fuel additives, and consumer goods.
Several factors are contributing to the market's development, especially as governments push for green energy solutions. The increased demand for bio-isobutene in industrial applications is a direct result of these regulatory pressures. Sustainability initiatives across the globe are aligning with consumer preferences, which are pushing industries to opt for renewable solutions. Additionally, advancements in production technologies, including fermentation and the development of new feedstock sources, are making bio-isobutene more accessible and cost-effective. This shift not only supports cleaner energy solutions but also helps companies comply with environmental regulations. As industries, particularly in the U.S., continue to prioritize greener alternatives, bio-isobutene has found its niche in key products such as fuel additives and specialty chemicals.
| Market Scope | |
|---|---|
| Start Year | 2024 |
| Forecast Year | 2025-2034 |
| Start Value | $29.9 Billion |
| Forecast Value | $47.9 Billion |
| CAGR | 4.9% |
The bio-isobutene market is segmented based on raw materials, which include natural gas, propylene, sugar beet, straw-derived feedstocks, and other sources like biomass, agricultural waste, and wood. Natural gas leads the market, contributing USD 10.6 billion in revenue in 2024, with its rapid growth attributed to an already established infrastructure that allows for efficient methane processing, producing bio-isobutene as a byproduct. Propylene and biomass-based feedstocks are also significant contributors to market expansion, each offering distinct production processes and applications. Among bio-isobutene products, methyl tert-butyl ether (MTBE) holds the largest market share at 25.4% in 2024. MTBE's importance lies in its role as an oxygenate in fuels, which boosts octane levels and reduces harmful emissions. As the focus on environmental sustainability intensifies, the demand for MTBE continues to rise, making it one of the fastest-growing products in the bio-isobutene market.
In the U.S., the bio-isobutene market is valued at USD 7.8 billion in 2024. This growth is propelled by a combination of regulatory pressures and the rising demand for sustainable alternatives across industries such as automotive and fuel additives. The U.S. market's expansion is also supported by advancements in bio-isobutene production technologies, including fermentation processes and the utilization of renewable feedstocks. Stricter fuel emission standards and the push for greener products are encouraging the widespread adoption of bio-isobutene, establishing it as a viable substitute for traditional petrochemical products in the region.
Table of Contents
Chapter 1 Methodology & Scope
- 1.1 Market scope & definitions
- 1.2 Base estimates & calculations
- 1.3 Forecast calculations
- 1.4 Data sources
- 1.4.1 Primary
- 1.4.2 Secondary
- 1.4.2.1 Paid sources
- 1.4.2.2 Public sources
Chapter 2 Executive Summary
- 2.1 Industry synopsis, 2021-2034
Chapter 3 Industry Insights
- 3.1 Industry ecosystem analysis
- 3.1.1 Factor affecting the value chain
- 3.1.2 Profit margin analysis
- 3.1.3 Disruptions
- 3.1.4 Future outlook
- 3.1.5 Manufacturers
- 3.1.6 Distributors
- 3.2 Supplier landscape
- 3.3 Profit margin analysis
- 3.4 Key news & initiatives
- 3.5 Regulatory landscape
- 3.6 Impact forces
- 3.6.1 Growth drivers
- 3.6.1.1 Rising demand for sustainable products
- 3.6.1.2 Government initiatives and regulations
- 3.6.1.3 Technological advancements
- 3.6.2 Industry pitfalls & challenges
- 3.6.2.1 High production costs
- 3.6.2.2 Supply chain challenges
- 3.6.1 Growth drivers
- 3.7 Growth potential analysis
- 3.8 Porter’s analysis
- 3.9 PESTEL analysis
Chapter 4 Competitive Landscape, 2024
- 4.1 Introduction
- 4.2 Company market share analysis
- 4.3 Competitive positioning matrix
- 4.4 Strategic outlook matrix
Chapter 5 Market Estimates & Forecast, By Raw Material, 2021-2034 (USD Billion) (Metric Tons)
- 5.1 Key trends
- 5.2 Natural gas
- 5.3 Propylene
- 5.4 Straw derived
- 5.5 Sugar beet and cane-derived
- 5.6 Others (biomass, agricultural waste, wood)
Chapter 6 Market Estimates & Forecast, By Products, 2021-2034 (USD Billion) (Metric Tons)
- 6.1 Key trends
- 6.2 Methyl tert-butyl ether (MTBE)
- 6.3 Ethyl tert-butyl ether (ETBE)
- 6.4 Tert-butyl alcohol (TBA)
- 6.5 Isobutylene
- 6.6 Polyisobutylene (PIB)
- 6.7 Tert-butyl hydroperoxide (TBHP)
Chapter 7 Market Estimates & Forecast, By Application, 2021-2034 (USD Billion) (Metric Tons)
- 7.1 Key trends
- 7.2 Automotive
- 7.3 Fuel additives
- 7.4 Adhesives and sealants
- 7.5 Cosmetics and personal care products
- 7.6 Pharmaceuticals
Chapter 8 Market Estimates & Forecast, By Region, 2021-2034 (USD Billion) (Metric Tons)
- 8.1 Key trends
- 8.2 North America
- 8.2.1 U.S.
- 8.2.2 Canada
- 8.3 Europe
- 8.3.1 UK
- 8.3.2 Germany
- 8.3.3 France
- 8.3.4 Italy
- 8.3.5 Spain
- 8.3.6 Russia
- 8.4 Asia Pacific
- 8.4.1 China
- 8.4.2 India
- 8.4.3 Japan
- 8.4.4 South Korea
- 8.4.5 Australia
- 8.5 Latin America
- 8.5.1 Brazil
- 8.5.2 Mexico
- 8.6 MEA
- 8.6.1 South Africa
- 8.6.2 Saudi Arabia
- 8.6.3 UAE
Chapter 9 Company Profiles
- 9.1 Amyris
- 9.2 BASF
- 9.3 Butamax advanced biofuels
- 9.4 DuPont de Nemours
- 9.5 Eastman
- 9.6 ExxonMobil
- 9.7 Fraunhofer
- 9.8 Global Bioenergies
- 9.9 Ineos
- 9.10 Lanxess
- 9.11 LyondellBasell
- 9.12 Sabic

