
PUBLISHER: Global Market Insights Inc. | PRODUCT CODE: 1716548

PUBLISHER: Global Market Insights Inc. | PRODUCT CODE: 1716548
Fiber Optic Preform Market Opportunity, Growth Drivers, Industry Trend Analysis, and Forecast 2025 - 2034
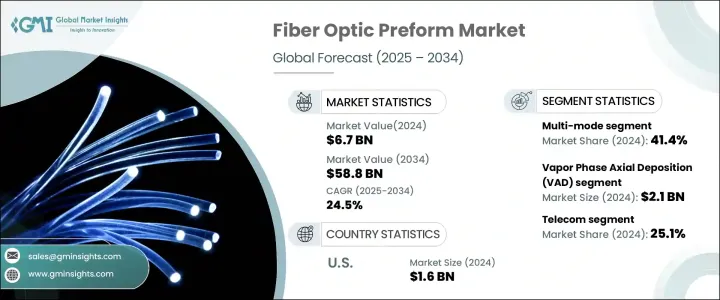
The Global Fiber Optic Preform Market generated USD 6.7 billion in 2024 and is expected to expand at a CAGR of 24.5% during 2025-2034. This remarkable growth is fueled by the increasing adoption of high-speed internet, driven by the rollout of 5G networks and rising demand for faster and more reliable data transmission. As modern digital infrastructure becomes essential for both businesses and households, fiber optic preforms play a pivotal role in enhancing network capacity and performance. These preforms are vital in creating fiber optic cables that enable seamless communication, cloud computing, and advanced technologies such as artificial intelligence (AI) and the Internet of Things (IoT).
Government initiatives and substantial investments in fiber infrastructure further accelerate market expansion, as countries worldwide focus on improving digital connectivity. Additionally, the proliferation of data centers, both hyperscale and edge-based, highlights the need for advanced fiber optic solutions to support the growing volume of data traffic. The increasing preference for high-capacity networks that can handle the surge in data-intensive applications, including video streaming, online gaming, and cloud services, further strengthens the market's upward trajectory.
| Market Scope | |
|---|---|
| Start Year | 2024 |
| Forecast Year | 2025-2034 |
| Start Value | $6.7 Billion |
| Forecast Value | $58.8 Billion |
| CAGR | 24.5% |
The market is segmented by product type into single-mode, multi-mode, and other categories. In 2024, the multi-mode segment held 41.4% of the market share. Multi-mode fibers are well-suited for short-distance communication, supporting advanced Ethernet technologies such as 100G, 400G, and 800G. Their cost-effectiveness in short-range applications, compared to single-mode fibers, makes them the preferred choice for businesses implementing Local Area Networks (LAN) and Storage Area Networks (SAN). Multi-mode fibers are also known for their ability to handle high data transmission rates efficiently over shorter distances, making them indispensable for enterprise networks.
By process, the fiber optic preform market is divided into Modified Chemical Vapor Deposition (MCVD), Vapor Phase Axial Deposition (VAD), Outside Vapor Deposition (OVD), and Plasma Activated Chemical Vapor Deposition (PCVD). The VAD process generated USD 2.1 billion in 2024. VAD is widely adopted in mass production environments due to its ability to produce long, continuous preforms with consistent quality. This method enables manufacturers to produce fiber optic cables in large quantities while maintaining high precision, meeting the increasing global demand for fiber optic solutions.
The U.S. fiber optic preform market generated USD 1.6 billion in 2024, reflecting the rising demand for high-capacity networks and increased investment in digital infrastructure. The rapid growth of cloud computing and AI has led to the expansion of data centers, creating a higher demand for reliable fiber optic solutions. Major telecommunications companies are investing heavily in fiber infrastructure to meet the growing need for faster and more reliable connectivity. As both consumers and businesses seek improved data transmission capabilities, fiber optic preforms remain an integral component in strengthening the country's digital infrastructure.
Table of Contents
Chapter 1 Methodology & Scope
- 1.1 Market scope & definitions
- 1.2 Base estimates & calculations
- 1.3 Forecast calculations
- 1.4 Data sources
- 1.4.1 Primary
- 1.4.2 Secondary
- 1.4.2.1 Paid sources
- 1.4.2.2 Public sources
Chapter 2 Executive Summary
- 2.1 Industry synopsis, 2021-2034
Chapter 3 Industry Insights
- 3.1 Industry ecosystem analysis
- 3.1.1 Factor affecting the value chain
- 3.1.2 Profit margin analysis
- 3.1.3 Disruptions
- 3.1.4 Future outlook
- 3.1.5 Manufacturers
- 3.1.6 Distributors
- 3.2 Supplier landscape
- 3.3 Profit margin analysis
- 3.4 Key news & initiatives
- 3.5 Regulatory landscape
- 3.6 Impact forces
- 3.6.1 Growth drivers
- 3.6.1.1 Rapid proliferation of 5G networks
- 3.6.1.2 Favorable government initiatives and investments
- 3.6.1.3 Increase in demand for high-speed internet
- 3.6.1.4 Growing deployment of submarine cable
- 3.6.1.5 Rise in advancements in fiber optic technology
- 3.6.2 Industry pitfalls & challenges
- 3.6.2.1 High production costs
- 3.6.2.2 Fluctuating raw material prices
- 3.6.1 Growth drivers
- 3.7 Growth potential analysis
- 3.8 Porter's analysis
- 3.9 PESTEL analysis
Chapter 4 Competitive Landscape, 2024
- 4.1 Introduction
- 4.2 Company market share analysis
- 4.3 Competitive positioning matrix
- 4.4 Strategic outlook matrix
Chapter 5 Market Estimates & Forecast, By Product Type, 2021-2034 (USD Billion)
- 5.1 Key trends
- 5.2 Single-Mode
- 5.3 Multi-Mode
- 5.4 Others
Chapter 6 Market Estimates & Forecast, By Process, 2021-2034 (USD Billion)
- 6.1 Key trends
- 6.2 Vapor Phase Axial Deposition (VAD)
- 6.3 Modified Chemical Vapor Deposition (MCVD)
- 6.4 Outside Vapor Deposition (OVD)
- 6.5 Plasma Activated Chemical Vapor Deposition (PCVD)
Chapter 7 Market Estimates & Forecast, By End Use Industry, 2021-2034 (USD Billion)
- 7.1 Key trends
- 7.2 Telecom
- 7.3 Oil & gas
- 7.4 Military & aerospace
- 7.5 BFSI
- 7.6 Medical
- 7.7 Railway
- 7.8 Others
Chapter 8 Market Estimates & Forecast, By Region, 2021-2034 (USD Billion)
- 8.1 Key trends
- 8.2 North America
- 8.2.1 U.S.
- 8.2.2 Canada
- 8.3 Europe
- 8.3.1 UK
- 8.3.2 Germany
- 8.3.3 France
- 8.3.4 Italy
- 8.3.5 Spain
- 8.3.6 Russia
- 8.4 Asia Pacific
- 8.4.1 China
- 8.4.2 India
- 8.4.3 Japan
- 8.4.4 South Korea
- 8.4.5 Australia
- 8.5 Latin America
- 8.5.1 Brazil
- 8.5.2 Mexico
- 8.6 MEA
- 8.6.1 South Africa
- 8.6.2 Saudi Arabia
- 8.6.3 UAE
Chapter 9 Company Profiles
- 9.1 Corning Incorporated
- 9.2 Fasten Group
- 9.3 FCJ OPTO TECH
- 9.4 Fujikura Ltd.
- 9.5 Futong Group
- 9.6 Hengtong Group
- 9.7 Heraeus Holding GmbH
- 9.8 Jiangsu Zhongtian Technology Co., Ltd.
- 9.9 OFS Fitel, LLC
- 9.10 Prysmian Group
- 9.11 Rosendahl Nextrom GmbH
- 9.12 Shin-Etsu Chemical Co., Ltd
- 9.13 Sterlite Technologies Limited
- 9.14 Sumitomo Electric Industries, Ltd
- 9.15 Yangtze Optical Fibre (YOFC)

