
PUBLISHER: Global Market Insights Inc. | PRODUCT CODE: 1716594

PUBLISHER: Global Market Insights Inc. | PRODUCT CODE: 1716594
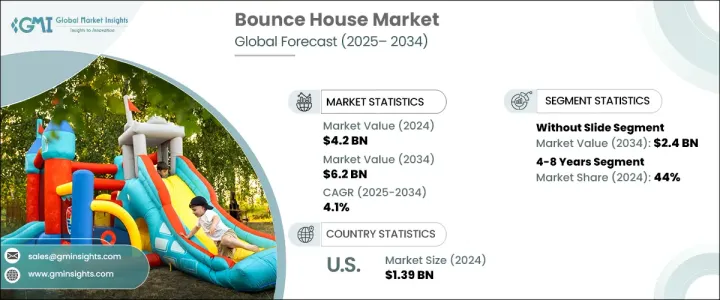
Bounce House Market Opportunity, Growth Drivers, Industry Trend Analysis, and Forecast 2025 - 2034
The Global Bounce House Market reached USD 4.2 billion in 2024 and is expected to grow at a CAGR of 4.1% during 2025-2034. The market continues to witness steady growth as the demand for inflatable entertainment solutions rises worldwide. As families increasingly seek safe, engaging, and affordable entertainment options for children, bounce houses have emerged as a top choice, offering fun-filled experiences for various occasions. The popularity of bounce houses is also tied to the growing number of amusement parks, family entertainment centers, and indoor playgrounds that are expanding their offerings to attract younger audiences.
These inflatable attractions, available in a wide range of themes and designs, are not just limited to commercial venues - they are now a common feature at birthday parties, school functions, corporate family events, and community festivals. With their vibrant colors, playful themes, and customizable features, bounce houses appeal to both children and parents who prioritize safety and enjoyment. Manufacturers are also focusing on introducing innovative designs that combine fun with safety, using high-quality, durable materials that comply with international safety standards. The market's growth is further supported by rising disposable incomes and a heightened focus on recreational activities for children, especially in urban areas where outdoor play spaces may be limited.
| Market Scope | |
|---|---|
| Start Year | 2024 |
| Forecast Year | 2025-2034 |
| Start Value | $4.2 Billion |
| Forecast Value | $6.2 Billion |
| CAGR | 4.1% |
The bounce house market is segmented based on product types, including bounce houses with slides, without slides, obstacle courses, combos, and others. Bounce houses without slides accounted for USD 1.6 billion in revenue in 2024 and are projected to generate USD 2.4 billion by 2034. These models are gaining traction for their versatility and broad appeal. Equipped with features like climbing walls, interactive obstacles, and creative themes, bounce houses without slides are a preferred choice for various events, including birthday parties, school carnivals, and church gatherings. Their visually attractive designs and ease of setup make them ideal for both indoor and outdoor use, contributing to their widespread popularity.
By age group, the bounce house market is divided into up to 4 years, 4-8 years, and over 8 years categories. The 4-8 years age group held a dominant 44% market share in 2024. Bounce houses in this segment are designed to meet the high-energy play needs of children, offering safe yet exciting environments that foster active play. For children under 4 years old, manufacturers focus on creating soft, low-height structures that encourage motor skill development and social interaction. For older children, bounce houses with more adventurous elements like obstacle courses and challenging climbs cater to their demand for thrilling play experiences.
The U.S. Bounce House Market is set to grow at a CAGR of 3.8% annually. As the leading market for inflatable entertainment, the U.S. benefits from a strong supply chain and a wide range of suppliers offering themed and customized bounce house designs. Rising consumer spending on leisure and recreational activities, combined with stringent safety regulations and quality standards, continues to drive market growth in the country.
Table of Contents
Chapter 1 Methodology & Scope
- 1.1 Market scope & definition
- 1.2 Base estimates & calculations
- 1.3 Forecast parameters
- 1.4 Data sources
- 1.4.1 Primary
- 1.5 Secondary
- 1.5.1.1 Paid sources
- 1.5.1.2 Public sources
Chapter 2 Executive Summary
- 2.1 Industry synopsis, 2021 - 2034
Chapter 3 Industry Insights
- 3.1 Industry ecosystem analysis
- 3.1.1 Factor affecting the value chain
- 3.1.2 Profit margin analysis
- 3.1.3 Disruptions
- 3.1.4 Future outlook
- 3.1.5 Manufacturers
- 3.1.6 Distributors
- 3.1.7 Retailers
- 3.2 Impact forces
- 3.2.1 Growth drivers
- 3.2.1.1 Increasing disposable income
- 3.2.1.2 Growing rental agencies
- 3.2.1.3 Growing amusement parks
- 3.2.2 Industry pitfalls & challenges
- 3.2.2.1 Weather sensitivity
- 3.2.2.2 Market saturation
- 3.2.1 Growth drivers
- 3.3 Consumer buying behavior analysis
- 3.3.1 Demographic trends
- 3.3.2 Factors affecting buying decision
- 3.3.3 Consumer product adoption
- 3.3.4 Preferred distribution channel
- 3.3.5 Preferred price range
- 3.4 Growth potential analysis
- 3.5 Regulatory landscape
- 3.6 Pricing analysis
- 3.7 Porter's analysis
- 3.8 PESTEL analysis
Chapter 4 Competitive Landscape, 2024
- 4.1 Introduction
- 4.2 Company market share analysis
- 4.3 Competitive positioning matrix
- 4.4 Strategic outlook matrix
Chapter 5 Market Estimates and Forecast, By Type, 2021 – 2034 (USD Billion) (Million Units)
- 5.1 Key trends
- 5.2 With slide
- 5.3 Without slide
- 5.4 Obstacle course
- 5.5 Combo
- 5.6 Others
Chapter 6 Market Estimates & Forecast, By Age Group, 2021-2034 (USD Billion) (Million Units)
- 6.1 Key trends
- 6.2 Upto 4 years
- 6.3 4-8 years
- 6.4 Above 8 years
Chapter 7 Market Estimates & Forecast, By Price Range, 2021-2034 (USD Billion) (Million Units)
- 7.1 Key trends
- 7.2 Low (upto 500$)
- 7.3 Mid (500$-1000$)
- 7.4 High (more than 1000$)
Chapter 8 Market Estimates & Forecast, By End Use, 2021-2034 (USD Billion) (Million Units)
- 8.1 Key trends
- 8.2 Individual
- 8.3 Commercial
Chapter 9 Market Estimates & Forecast, By Distribution Channel, 2021-2034 (USD Billion) (Million Units)
- 9.1 Key trends
- 9.2 Online
- 9.3 Offline
Chapter 10 Market Estimates & Forecast, By Region, 2021 – 2034, (USD Billion) (Million Units)
- 10.1 Key trends
- 10.2 North America
- 10.2.1 U.S.
- 10.2.2 Canada
- 10.3 Europe
- 10.3.1 UK
- 10.3.2 Germany
- 10.3.3 France
- 10.3.4 Italy
- 10.3.5 Spain
- 10.4 Asia Pacific
- 10.4.1 China
- 10.4.2 Japan
- 10.4.3 India
- 10.4.4 South Korea
- 10.4.5 Australia
- 10.5 Latin America
- 10.5.1 Brazil
- 10.5.2 Mexico
- 10.6 MEA
- 10.6.1 South Africa
- 10.6.2 Saudi Arabia
- 10.6.3 UAE
Chapter 11 Company Profiles (Business Overview, Financial Data, Product Landscape, Strategic Outlook, SWOT Analysis)
- 11.1 B-Air
- 11.2 Blast Zone
- 11.3 Bouncer Depot
- 11.4 Cloud 9
- 11.5 Commercial Inflatable
- 11.6 Cutting Edge Creations
- 11.7 EZ Inflatables
- 11.8 HEC Worldwide
- 11.9 House of Bounce
- 11.10 Inflatable Depot
- 11.11 Jungle Jumps
- 11.12 Magic Jump
- 11.13 Ninja Jump
- 11.14 Tent and Table
- 11.15 Ultimate Jumpers

