
PUBLISHER: Global Market Insights Inc. | PRODUCT CODE: 1716698

PUBLISHER: Global Market Insights Inc. | PRODUCT CODE: 1716698
Storage Area Network Switches Market Opportunity, Growth Drivers, Industry Trend Analysis, and Forecast 2025 - 2034
The Global Storage Area Network Switches Market reached USD 21.4 billion in 2024 and is expected to grow at a CAGR of 10.8% from 2025 to 2034. This growth is driven by the global rollout of high-speed 5G networks, widespread adoption of high-speed fiber optics, and the growing importance of data centers and cloud computing. These advancements are pushing organizations to move from traditional SAN storage systems to more sophisticated, high-port-density switching interconnects. As a result, SAN switches are now considered essential for modern infrastructures, providing scalable storage solutions that ensure seamless data mobility across multiple cloud platforms.
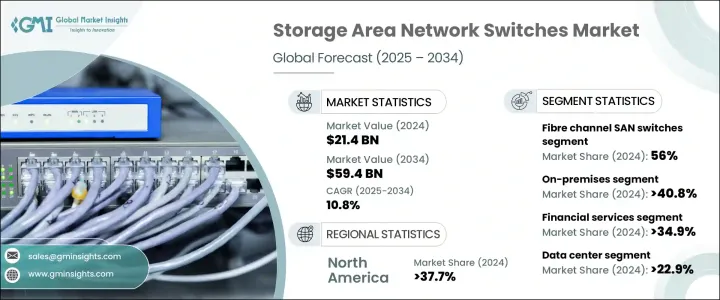
The market for SAN switches is divided into two primary types: fiber channel SAN switches and Ethernet SAN switches. In 2024, fiber channel SAN switches dominate the market, holding a share of 56%, and are expected to grow at the fastest rate, with a CAGR of 12%. Fiber channel SAN switches are increasingly preferred for high-performance environments, particularly in sectors that require low-latency and reliable storage solutions, such as healthcare and finance.
| Market Scope | |
|---|---|
| Start Year | 2024 |
| Forecast Year | 2025-2034 |
| Start Value | $21.4 Billion |
| Forecast Value | $59.4 Billion |
| CAGR | 10.8% |
By deployment type, the market is segmented into on-premises, cloud-based, and hybrid models. In 2024, the on-premises segment holds the largest market share at over 40.8%, while cloud-based SAN switches are the fastest-growing segment, expected to grow at a CAGR of 12.4%. The on-premises market is valued at USD 8.7 billion in 2024 and is projected to maintain steady growth due to strict compliance regulations in industries such as healthcare and defense, where secure, high-performance storage is critical.
In terms of application, the SAN switches market is categorized into data storage and backup, virtualization, data centers, enterprise networking, cloud computing, and others. Data centers hold the largest market share, accounting for 22.9% of the total in 2024, and are expected to see the fastest growth with a CAGR of 12.6%. This trend is linked to the expanding demand for storage solutions in hyperscale data centers, driven by the need for high-performance and energy-efficient systems.
For end-use industries, financial services lead the market, making up 34.9% of the total market share in 2024, with the fastest growth projected at a CAGR of 12.2%. As financial institutions increasingly rely on SAN switches for tasks such as high-frequency trading and real-time data processing, the demand for these technologies is expected to continue rising.
Geographically, North America is the largest market for SAN switches, accounting for 37.7% of the global share in 2024. Meanwhile, the Asia-Pacific region is experiencing the fastest growth, with a projected CAGR of 12.2%, fueled by the region's rapid digital transformation.
Table of Contents
Chapter 1 Methodology & Scope
- 1.1 Market scope & definitions
- 1.2 Research design
- 1.2.1 Research approach
- 1.2.2 Data collection methods
- 1.3 Base estimates & calculations
- 1.3.1 Base year calculation
- 1.3.2 Key trends for market estimation
- 1.4 Forecast model
- 1.5 Primary research and validation
- 1.5.1 Primary sources
- 1.5.2 Data mining sources
Chapter 2 Executive Summary
- 2.1 Industry 3600 synopsis
Chapter 3 Industry Insights
- 3.1 Industry ecosystem analysis
- 3.2 Vendor matrix
- 3.3 Profit margin analysis
- 3.4 Technology & innovation landscape
- 3.5 Patent analysis
- 3.6 Key news and initiatives
- 3.7 Industry impact forces
- 3.7.1 Growth drivers
- 3.7.1.1 Expansion of 5G and fiber networks
- 3.7.1.2 Automotive LiDAR integration
- 3.7.1.3 Increasing demand for medical imaging
- 3.7.1.4 Industrial automation and smart manufacturing
- 3.7.1.5 Expansion of data centers and cloud computing services.
- 3.7.2 Industry pitfalls & challenges
- 3.7.2.1 High capital expenditure
- 3.7.2.2 Rapid technological obsolescence
- 3.7.1 Growth drivers
- 3.8 Growth potential analysis
- 3.9 Porter's analysis
- 3.10 PESTEL analysis
- 3.11 Future market trends
- 3.12 Regulatory landscape
Chapter 4 Market Estimates and Forecast, By Type, 2021 – 2034 ($ Bn)
- 4.1 Key trends
- 4.2 Fibre channel SAN switches
- 4.2.1 4 Gbps
- 4.2.2 8 Gbps
- 4.2.3 16 Gbps
- 4.2.4 32 Gbps
- 4.3 Ethernet SAN switches
- 4.3.1 1 GbE
- 4.3.2 10 GbE
- 4.3.3 25 GbE
- 4.3.4 40 GbE
- 4.3.5 100 GbE
Chapter 5 Market Estimates and Forecast, By Deployment Type 2021 – 2034 (USD Bn)
- 5.1 Key trends
- 5.2 On-premises
- 5.3 Cloud
- 5.4 Hybrid
Chapter 6 Market Estimates and Forecast, By Application 2021 – 2034 (USD Bn)
- 6.1 Key trends
- 6.2 Data storage and backup
- 6.3 Virtualization
- 6.4 Data centers
- 6.5 Enterprise networking
- 6.6 Cloud computing
- 6.7 Others
Chapter 7 Market Estimates and Forecast, By End Use Industry 2021 – 2034 (USD Bn)
- 7.1 Key trends
- 7.2 Financial services
- 7.3 Telecommunications
- 7.4 Government
- 7.5 Media and entertainment
- 7.6 Aviation
- 7.7 Others
Chapter 8 Market Estimates and Forecast, By Region, 2021– 2034 ($ Bn)
- 8.1 Key trends
- 8.2 North America
- 8.2.1 The U.S.
- 8.2.2 Canada
- 8.3 Europe
- 8.3.1 Germany
- 8.3.2 UK
- 8.3.3 France
- 8.3.4 Spain
- 8.3.5 Italy
- 8.3.6 Rest of Europe
- 8.4 Asia Pacific
- 8.4.1 Japan
- 8.4.2 China
- 8.4.3 India
- 8.4.4 South Korea
- 8.4.5 ANZ
- 8.4.6 Rest of Asia Pacific
- 8.5 Latin America
- 8.5.1 Brazil
- 8.5.2 Mexico
- 8.5.3 Rest of Latin America
- 8.6 Middle East and Africa
- 8.6.1 South Africa
- 8.6.2 UAE
- 8.6.3 Saudi Arabia
- 8.6.4 Rest of Middle East and Africa
Chapter 9 Company Profiles
- 9.1 Arista Networks, Inc.
- 9.2 ATTO Technology, Inc.
- 9.3 Brocade Communications Systems, Inc.
- 9.4 Cisco Systems, Inc.
- 9.5 Dell Technologies Inc.
- 9.6 Extreme Networks, Inc.
- 9.7 Fortinet, Inc.
- 9.8 Fujitsu Limited
- 9.9 Hewlett Packard Enterprise (HPE) Development LP
- 9.10 Huawei Technologies Co., Ltd.
- 9.11 IBM Corporation
- 9.12 Juniper Networks, Inc.
- 9.13 Lenovo Group Limited
- 9.14 NEC Corporation
- 9.15 QLogic Corporation (part of Marvell Technology Group)

