
PUBLISHER: Global Market Insights Inc. | PRODUCT CODE: 1721528

PUBLISHER: Global Market Insights Inc. | PRODUCT CODE: 1721528
Capacitor Bank Market Opportunity, Growth Drivers, Industry Trend Analysis, and Forecast 2025 - 2034
The Global Capacitor Bank Market was valued at USD 3.1 billion in 2024 and is estimated to grow at a CAGR of 4% to reach USD 4.6 billion by 2034. This growth comes as energy-intensive economies, both developed and developing, continue to prioritize energy efficiency and grid reliability. With the global demand for electricity rising at an unprecedented rate, industries and governments are turning to capacitor banks as essential components to stabilize voltage levels, improve power factor, and reduce energy losses. The modernization of power infrastructure, especially in fast-urbanizing regions, has created a thriving landscape for the deployment of these systems. Market players are responding to this demand by introducing compact, smart, and digitally enabled capacitor banks that align with next-gen grid requirements. The rising integration of renewable energy sources like wind and solar into the grid is also increasing the need for reactive power support, making capacitor banks a key enabler for energy transition goals. In line with sustainability objectives, policymakers are pushing for low-loss power systems that operate with maximum efficiency. These trends are further backed by public-private partnerships focused on long-term grid upgrades and resilience enhancement projects worldwide.
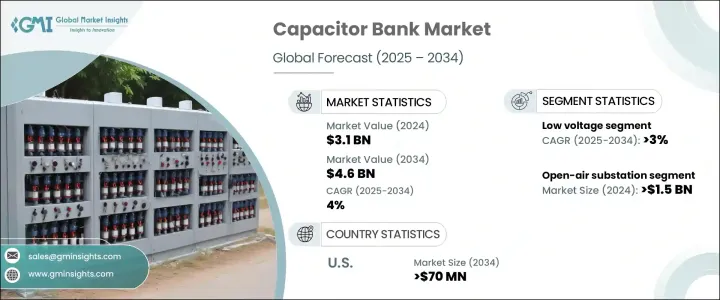
By voltage, the low voltage segment is set to grow steadily at a CAGR of 3% through 2034. This growth is being driven by mounting energy demands in underdeveloped regions with limited infrastructure and continuous network improvements across developed economies. As residential, commercial, and light industrial users seek better power quality and system stability, low-voltage capacitor banks are gaining traction. Their compact design, ease of integration, and cost efficiency make them ideal for areas undergoing rapid infrastructure expansion. These units offer the flexibility needed to accommodate shifting load demands while ensuring energy savings and equipment longevity.
| Market Scope | |
|---|---|
| Start Year | 2024 |
| Forecast Year | 2025-2034 |
| Start Value | $3.1 Billion |
| Forecast Value | $4.6 Billion |
| CAGR | 4% |
In terms of configuration, the open-air substation segment generated USD 1.5 billion in 2024. The segment's growth is supported by sustained investments in large-scale power transmission projects and smart grid technologies. Utilities prefer these systems due to their ability to stabilize voltage across extended distribution networks, particularly in high-load scenarios. Industries such as manufacturing, renewables, and telecommunications are increasingly relying on these configurations to ensure uninterrupted power delivery and scalable infrastructure solutions.
The United States Capacitor Bank Market generated USD 557.8 million in 2024 and is projected to reach USD 700 million by 2034. The growing adoption of electric vehicles and large-scale expansion of data centers are fueling the need for enhanced reactive power compensation. With an advanced grid structure and strong regulatory push for low-emission systems, the U.S. continues to lead in deploying high-performance capacitor banks.
Key players in the Global Capacitor Bank Market include ZEZ SILKO, CIRCUTOR, SHARDA Electronics, LAXMI ELECTRONICS, ABB, Schneider Electric, General Electric, Siemens, LIFASA, Hitachi Energy, ARTECHE, Powerside, Aener Energia, Eaton, and Enerlux Power. Companies are investing heavily in R&D to launch smart, efficient, and remote-monitoring enabled capacitor banks. Strategic partnerships with utilities and government entities are helping these firms offer region-specific solutions and tap into new market opportunities through targeted acquisitions.
Table of Contents
Chapter 1 Methodology & Scope
- 1.1 Research design
- 1.2 Market estimates & forecast parameters
- 1.3 Forecast calculation
- 1.4 Data sources
- 1.4.1 Primary
- 1.4.2 Secondary
- 1.4.2.1 Paid
- 1.4.2.2 Public
- 1.5 Market definitions
Chapter 2 Executive Summary
- 2.1 Industry synopsis, 2021 - 2034
Chapter 3 Industry Insights
- 3.1 Industry ecosystem analysis
- 3.2 Regulatory landscape
- 3.3 Industry impact forces
- 3.3.1 Growth drivers
- 3.3.2 Industry pitfalls & challenges
- 3.4 Growth potential analysis
- 3.5 Porter's analysis
- 3.5.1 Bargaining power of suppliers
- 3.5.2 Bargaining power of buyers
- 3.5.3 Threat of new entrants
- 3.5.4 Threat of substitutes
- 3.6 PESTEL analysis
Chapter 4 Competitive Landscape, 2025
- 4.1 Introduction
- 4.2 Strategic outlook
- 4.3 Innovation & sustainability landscape
Chapter 5 Market Size and Forecast, By Voltage, 2021 - 2034 (USD Million & '000 Units)
- 5.1 Key trends
- 5.2 Low [<10 kV]
- 5.3 Medium [10 kV - 69 kV]
- 5.4 High [>69 kV]
Chapter 6 Market Size and Forecast, By Type, 2021 - 2034 (USD Million & '000 Units)
- 6.1 Key trends
- 6.2 Open air substation
- 6.3 Metal enclosed substation
- 6.4 Pole mounted
- 6.5 Others
Chapter 7 Market Size and Forecast, By Application, 2021 - 2034 (USD Million & '000 Units)
- 7.1 Key trends
- 7.2 Power factor correction
- 7.3 Harmonic filter
- 7.4 Voltage regulation
- 7.5 Renewable integration
- 7.6 Industrial application
- 7.7 Data centers
- 7.8 Others
Chapter 8 Market Size and Forecast, By Region, 2021 - 2034 (USD Million & '000 Units)
- 8.1 Key trends
- 8.2 North America
- 8.2.1 U.S.
- 8.2.2 Canada
- 8.2.3 Mexico
- 8.3 Europe
- 8.3.1 Germany
- 8.3.2 France
- 8.3.3 Spain
- 8.3.4 Italy
- 8.3.5 UK
- 8.3.6 Netherlands
- 8.3.7 Russia
- 8.3.8 Sweden
- 8.4 Asia Pacific
- 8.4.1 China
- 8.4.2 India
- 8.4.3 Japan
- 8.4.4 South Korea
- 8.4.5 Indonesia
- 8.4.6 New Zealand
- 8.4.7 Malaysia
- 8.4.8 Thailand
- 8.4.9 Singapore
- 8.4.10 Australia
- 8.5 Middle East & Africa
- 8.5.1 Saudi Arabia
- 8.5.2 UAE
- 8.5.3 Qatar
- 8.5.4 Oman
- 8.5.5 South Africa
- 8.6 Latin America
- 8.6.1 Brazil
- 8.6.2 Chile
- 8.6.3 Argentina
Chapter 9 Company Profiles
- 9.1 ABB
- 9.2 Aener Energia
- 9.3 ARTECHE
- 9.4 LAXMI ELECTRONICS
- 9.5 CIRCUTOR
- 9.6 Eaton
- 9.7 Enerlux Power
- 9.8 General Electric
- 9.9 Hitachi Energy
- 9.10 SHARDA Electronics
- 9.11 Powerside
- 9.12 Schneider Electric
- 9.13 LIFASA
- 9.14 Siemens
- 9.15 ZEZ SILKO

