
PUBLISHER: Global Market Insights Inc. | PRODUCT CODE: 1740893

PUBLISHER: Global Market Insights Inc. | PRODUCT CODE: 1740893
Structural Copper Wire Market Opportunity, Growth Drivers, Industry Trend Analysis, and Forecast 2025 - 2034
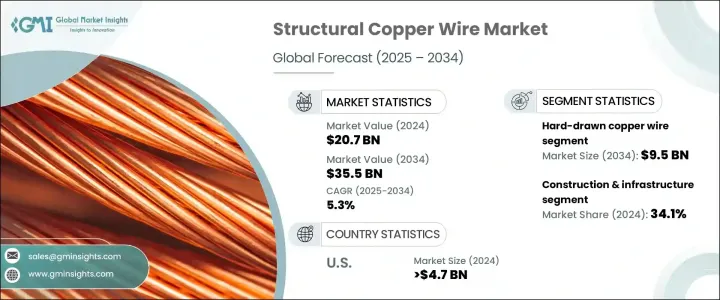
The Global Structural Copper Wire Market was valued at USD 20.7 billion in 2024 and is estimated to grow at a CAGR of 5.3% to reach USD 35.5 billion by 2034, driven by increasing demand for mechanically robust, corrosion-resistant wiring solutions across various critical sectors. Unlike standard electrical copper wire, structural copper wire is engineered to withstand physical stress, weather conditions, and long-term exposure, making it suitable for use in high-demand environments. With the expansion of smart infrastructure and rapid industrial development worldwide, these wires play a vital role in delivering both conductivity and durability. Demand is surging from sectors focused on large-scale infrastructure, modernization of energy systems, and the push toward electrification in urban landscapes. As countries focus on upgrading their infrastructure networks, strong and reliable copper wire solutions are becoming essential.
Additionally, the shift toward sustainable energy systems opens new avenues for structural copper wiring, particularly in renewable energy projects such as solar fields, wind farms, and energy storage systems. Copper's exceptional conductivity and durability make it ideal material for the demanding environments found in these applications, where long-term reliability is essential. In solar energy systems, copper wiring connects solar panels to the grid, ensuring efficient power transmission while withstanding the outdoor elements.
| Market Scope | |
|---|---|
| Start Year | 2024 |
| Forecast Year | 2025-2034 |
| Start Value | $20.7 Billion |
| Forecast Value | $35.5 Billion |
| CAGR | 5.3% |
Among the different product categories, hard-drawn copper wire generated the highest revenue in 2024, reaching USD 5.6 billion, and is anticipated to hit USD 9.5 billion by 2034. These wires are chosen for their mechanical toughness and are more resistant to tension compared to softer alternatives. Their structure makes them ideal for applications involving physical strain, such as in grounding, power distribution, and wiring installations that demand strength and durability. Hard-drawn wires maintain their integrity under stress, providing a dependable solution for construction and infrastructure.
The construction and infrastructure industry led the market by accounting for 34.1% share. Copper's unmatched electrical conductivity and its strength-to-size efficiency make it the material of choice for building projects. Because copper allows for smaller-diameter conductors without sacrificing performance, it provides advantages in installation and space optimization. In wiring systems, more copper wires can fit into a single conduit compared to alternative materials, contributing to streamlined construction design.
United States Structural Copper Wire Market was valued at USD 4.7 billion in 2024 and is projected to grow at a CAGR of 5.5% from 2025 to 2034, driven by the growing adoption of copper wiring for high-performance electrical systems across commercial and institutional projects. Ongoing upgrades to existing electrical networks and rising energy efficiency regulations further drive the demand for copper, offering both regulatory compliance and energy-saving benefits.
Key players in the Global Structural Copper Wire Market include General Cable Technologies Corporation, Sumitomo Electric Industries, Prysmian Group, Nexans, and Alan Wire Company. Leading companies in this market are adopting forward-thinking strategies. These include investing in next-generation manufacturing technologies to enhance product durability and consistency, and forming strategic alliances to enter untapped regions. Firms are also innovating product formulations by combining copper with advanced alloys to improve performance in harsh environments. Emphasizing sustainability, many manufacturers are shifting to recyclable materials and energy-efficient processes to align with environmental regulations and meet customer expectations for greener solutions.
Table of Contents
Chapter 1 Methodology & Scope
- 1.1 Market scope & definition
- 1.2 Base estimates & calculations
- 1.3 Forecast calculation
- 1.4 Data sources
- 1.4.1 Primary
- 1.4.2 Secondary
- 1.4.2.1 Paid sources
- 1.4.2.2 Public sources
Chapter 2 Executive Summary
- 2.1 Industry synopsis, 2021 - 2034
Chapter 3 Industry Insights
- 3.1 Industry ecosystem analysis
- 3.1.1 Factor affecting the value chain
- 3.1.2 Profit margin analysis
- 3.1.3 Disruptions
- 3.1.4 Future outlook
- 3.1.5 Manufacturers
- 3.1.6 Distributors
- 3.2 Trump administration tariffs
- 3.2.1 Impact on trade
- 3.2.1.1 Trade volume disruptions
- 3.2.1.2 Retaliatory measures
- 3.2.2 Impact on the industry
- 3.2.2.1 Supply-side impact (raw materials)
- 3.2.2.1.1 Price volatility in key materials
- 3.2.2.1.2 Supply chain restructuring
- 3.2.2.1.3 Production cost implications
- 3.2.2.2 Demand-side impact (selling price)
- 3.2.2.2.1 Price transmission to end markets
- 3.2.2.2.2 Market share dynamics
- 3.2.2.2.3 Consumer response patterns
- 3.2.2.1 Supply-side impact (raw materials)
- 3.2.3 Key companies impacted
- 3.2.4 Strategic industry responses
- 3.2.4.1 Supply chain reconfiguration
- 3.2.4.2 Pricing and product strategies
- 3.2.4.3 Policy engagement
- 3.2.5 Outlook and future considerations
- 3.2.1 Impact on trade
- 3.3 Trade statistics (hs code)
- 3.3.1 Major exporting countries, 2021-2024 (usd mn)
- 3.3.2 Major importing countries, 2021-2024 (usd mn)
Note: The above trade statistics will be provided for key countries only
- 3.4 Supplier landscape
- 3.5 Profit margin analysis
- 3.6 Key news & initiatives
- 3.7 Regulatory landscape
- 3.8 Impact forces
- 3.8.1 Growth drivers
- 3.8.1.1 Infrastructure modernization & expansion
- 3.8.1.2 Rise in renewable energy projects
- 3.8.1.3 Growing aerospace & defense investments
- 3.8.2 Industry pitfalls & challenges
- 3.8.2.1 High material & production costs
- 3.8.1 Growth drivers
- 3.9 Growth potential analysis
- 3.10 Porter's analysis
- 3.11 PESTEL analysis
Chapter 4 Competitive Landscape, 2024
- 4.1 Introduction
- 4.2 Company market share analysis
- 4.3 Competitive positioning matrix
- 4.4 Strategic outlook matrix
Chapter 5 Market Size and Forecast, By Type, 2021 - 2034 (USD Million) (Tons)
- 5.1 Key trends
- 5.2 Hard-drawn copper wire
- 5.3 Copper-clad steel wire (CCS)
- 5.4 Copper-clad aluminum wire (CCA)
- 5.5 Beryllium copper wire
- 5.6 Titanium-clad copper wire
- 5.7 Others
Chapter 6 Market Size and Forecast, By Application, 2021 - 2034 (USD Million) (Tons)
- 6.1 Key trends
- 6.2 Construction & infrastructure
- 6.3 Power transmission & distribution
- 6.4 Railways & transportation
- 6.5 Aerospace & defense
- 6.6 Marine & offshore installations
- 6.7 Others
Chapter 7 Market Size and Forecast, By Voltage, 2021 - 2034 (USD Million) (Tons)
- 7.1 Key trends
- 7.2 Low voltage
- 7.3 Medium voltage
- 7.4 High voltage
Chapter 8 Market Size and Forecast, By Region, 2021 - 2034 (USD Million) (Tons)
- 8.1 Key trends
- 8.2 North America
- 8.2.1 U.S.
- 8.2.2 Canada
- 8.3 Europe
- 8.3.1 UK
- 8.3.2 Germany
- 8.3.3 France
- 8.3.4 Italy
- 8.3.5 Spain
- 8.3.6 Netherlands
- 8.4 Asia Pacific
- 8.4.1 China
- 8.4.2 India
- 8.4.3 Japan
- 8.4.4 South Korea
- 8.4.5 Australia
- 8.5 Latin America
- 8.5.1 Brazil
- 8.5.2 Mexico
- 8.5.3 Argentina
- 8.6 MEA
- 8.6.1 South Africa
- 8.6.2 Saudi Arabia
- 8.6.3 UAE
Chapter 9 Company Profiles
- 9.1 Prysmian Group
- 9.2 Alan Wire Company
- 9.3 Nexans
- 9.4 General Cable Technologies Corporation
- 9.5 Sumitomo Electric Industries
- 9.6 Aviva Metals
- 9.7 Luvata
- 9.8 NINGBO JINTIAN COPPER (GROUP)
- 9.9 SH Copper Products
- 9.10 Tatung

