
PUBLISHER: Global Market Insights Inc. | PRODUCT CODE: 1740905

PUBLISHER: Global Market Insights Inc. | PRODUCT CODE: 1740905
Predictive Quality Assurance Equipment Market Opportunity, Growth Drivers, Industry Trend Analysis, and Forecast 2025 - 2034
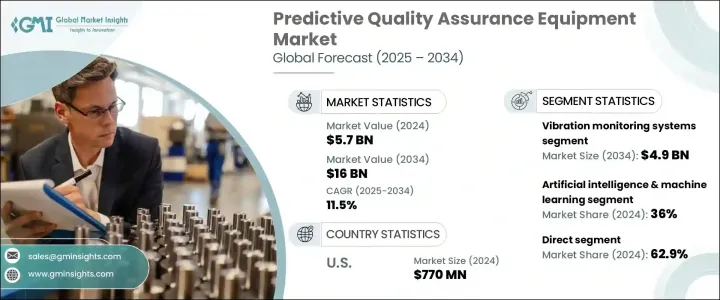
The Global Predictive Quality Assurance Equipment Market was valued at USD 5.7 billion in 2024 and is estimated to grow at a CAGR of 11.5% to reach USD 16 billion by 2034, driven by innovations in automation and smart manufacturing. As the global industrial landscape shifts towards digitalization, predictive QA solutions are becoming essential for maintaining product integrity and production efficiency. Today's manufacturing environments demand zero-defect products and maximum uptime, and predictive QA systems deliver on both fronts. These solutions are helping manufacturers achieve lean operations by minimizing rework, reducing material waste, and cutting downtime through proactive defect detection.
With the rise of Industry 4.0, companies across sectors are leveraging data analytics, sensor-based monitoring, and advanced algorithms to optimize their production cycles. Predictive quality assurance doesn't just improve the process-it transforms it. Whether it's identifying subtle performance trends or providing early warnings about potential faults, these systems are empowering manufacturers to stay competitive in a fast-evolving global market. The integration of AI, IoT, and cloud-based technologies in quality assurance equipment is accelerating digital transformation across multiple verticals, including automotive, aerospace, electronics, and medical devices. This trend is not only redefining quality control processes but also boosting customer satisfaction, as products are now more reliable, compliant, and consistent than ever before.
| Market Scope | |
|---|---|
| Start Year | 2024 |
| Forecast Year | 2025-2034 |
| Start Value | $5.7 Billion |
| Forecast Value | $16 Billion |
| CAGR | 11.5% |
As industries increasingly embrace Industry 4.0, integrating artificial intelligence (AI) and the Internet of Things (IoT) enhances product quality and operational efficiency. Predictive QA systems are vital for high-volume manufacturing as they help detect defects early, reducing downtime and minimizing waste. These systems offer valuable insights into production processes, ensuring consistent product quality while preventing potential issues before they arise.
Rising regulatory demands for safety and compliance in sectors such as automotive, aerospace, and healthcare are also fueling the market. To meet strict production standards and mitigate the risk of recalls, companies are increasingly turning to predictive QA solutions. These tools provide in-depth data analysis and traceability, allowing manufacturers to take immediate corrective actions when necessary. This not only helps prevent costly product failures but also ensures that products meet regulatory requirements, safeguarding the reputation of manufacturers.
The market is segmented by technology type, including AI & machine learning, edge computing, and digital twin technology. In 2024, AI and machine learning held a dominant market share of around 36%. This segment is projected to grow at a CAGR of 12.6% through 2034. The application of AI and ML in predictive QA is revolutionizing the field by enabling the analysis of large datasets, automating defect detection, and identifying hidden patterns, thereby improving the overall QA process. AI and machine learning is transforming the predictive quality assurance equipment market by providing tools that can process vast amounts of data in real time. These technologies are not only automating defect detection but also enhancing the accuracy of predictions, enabling companies to anticipate quality issues before they arise.
In terms of distribution channels, the market is divided into direct and indirect segments. The direct segment accounted for a 62.9% share in 2024, and it is expected to continue its growth at a CAGR of 11.3% through 2034. Direct distribution channels are preferred as they allow manufacturers to interact directly with end-users, fostering strong relationships and providing tailored solutions. This model also streamlines after-sales support, feedback collection, and technical assistance, which are essential in precision-driven industries.
U.S. Predictive Quality Assurance Equipment Market generated USD 770 million in 2024 and is expected to grow at a CAGR of 11% through 2034. The U.S. has become a leader in this market, driven by rapid technological adoption and a focus on industrial automation. The strong industrial base, including key sectors like aerospace, automotive, and healthcare, ensures a steady demand for high-precision QA tools. By embracing predictive QA technology, companies are not only improving product quality but also increasing their operational efficiency, which is helping to shape the future of manufacturing in the U.S. and globally.
Key players involved in the Global Predictive Quality Assurance Equipment Market include Schaeffler Technologies AG, Honeywell International Inc., Kistler Group, Emerson Electric Co., SPM Instrument AB, Rockwell Automation, Siemens AG, PCB Piezotronics, General Electric (GE), Pruftechnik, Meggitt PLC, SKF, Fluke Corporation, Bruel & Kjaer, and National Instruments. To strengthen their market presence, companies in the predictive quality assurance equipment sector focus on several strategies. These include investing in advanced technologies such as AI and IoT, expanding their global distribution networks, and offering customized solutions that meet the unique needs of various industries. Additionally, forming strategic partnerships and collaborations with other industry leaders helps enhance product offerings and broaden market reach.
Table of Contents
Chapter 1 Methodology & Scope
- 1.1 Market scope & definition
- 1.2 Base estimates & calculations
- 1.3 Forecast parameters
- 1.4 Data sources
- 1.4.1 Primary
- 1.5 Secondary
- 1.5.1.1 Paid sources
- 1.5.1.2 Public sources
Chapter 2 Executive Summary
- 2.1 Industry synopsis, 2021 - 2034
Chapter 3 Industry Insights
- 3.1 Industry ecosystem analysis
- 3.1.1 Factor affecting the value chain
- 3.1.2 Profit margin analysis
- 3.1.3 Disruptions
- 3.1.4 Future outlook
- 3.1.5 Manufacturers
- 3.1.6 Distributors
- 3.1.7 Retailers
- 3.2 Trump administration tariffs analysis
- 3.2.1 Impact on trade
- 3.2.1.1 Trade volume disruptions
- 3.2.1.2 Retaliatory measures
- 3.2.2 Impact on the industry
- 3.2.3 Supply-Side impact (Raw Materials)
- 3.2.3.1 Price volatility in key materials
- 3.2.3.2 Supply chain restructuring
- 3.2.3.3 Production cost implications
- 3.2.3.4 Demand-Side impact (Selling Price)
- 3.2.3.5 Price transmission to end markets
- 3.2.3.6 Market share dynamics
- 3.2.3.7 Consumer response patterns
- 3.2.4 Key companies impacted
- 3.2.5 Strategic industry responses
- 3.2.5.1 Supply chain reconfiguration
- 3.2.5.2 Pricing and product strategies
- 3.2.5.3 Policy engagement
- 3.2.6 Outlook and future considerations
- 3.2.1 Impact on trade
- 3.3 Supplier landscape
- 3.4 Profit margin analysis
- 3.5 Key news & initiatives
- 3.6 Regulatory landscape
- 3.7 Impact forces
- 3.7.1 Growth drivers
- 3.7.1.1 Integration of AI and machine learning in quality systems
- 3.7.1.2 Rising demand for Industry 4.0 and smart manufacturing
- 3.7.1.3 Increasing need for real-time defect detection
- 3.7.2 Industry pitfalls & challenges
- 3.7.2.1 High initial investment and implementation costs
- 3.7.2.2 Lack of skilled workforce for system operation and maintenance
- 3.7.1 Growth drivers
- 3.8 Growth potential analysis
- 3.9 Trade Analysis
- 3.10 Porter's analysis
- 3.11 PESTEL analysis
Chapter 4 Competitive Landscape, 2024
- 4.1 Introduction
- 4.2 Company market share analysis
- 4.3 Competitive positioning matrix
- 4.4 Strategic outlook matrix
Chapter 5 Market Estimates & Forecast, By Equipment Type, 2021 - 2034, (USD Billion) (Thousand Units)
- 5.1 Key trends
- 5.2 Vibration monitoring systems
- 5.3 Thermal imaging equipment
- 5.4 Ultrasonic testing devices
- 5.5 Laser alignment tools
- 5.6 Acoustic emission detectors
- 5.7 Condition monitoring sensors
- 5.8 Others
Chapter 6 Market Estimates & Forecast, By Technology, 2021 - 2034, (USD Billion) (Thousand Units)
- 6.1 Key trends
- 6.2 Artificial intelligence & machine learning
- 6.3 Edge computing
- 6.4 Digital twin technology
- 6.5 Others
Chapter 7 Market Estimates & Forecast, By Operation Size Type, 2021 - 2034, (USD Billion) (Thousand Units)
- 7.1 Key trends
- 7.2 Small & Medium Enterprises (SME)
- 7.3 Large enterprises
Chapter 8 Market Estimates & Forecast, By Application, 2021 - 2034, (USD Billion) (Thousand Units)
- 8.1 Key trends
- 8.2 Rotating equipment monitoring
- 8.3 Gearbox & bearing fault detection
- 8.4 Tool wear and failure prediction
- 8.5 Production line quality control
- 8.6 Heat and pressure anomaly detection
- 8.7 Others
Chapter 9 Market Estimates & Forecast, By End Use, 2021 - 2034, (USD Billion) (Thousand Units)
- 9.1 Key trends
- 9.2 Automotive
- 9.3 Heavy engineering & construction equipment
- 9.4 Oil & gas machinery
- 9.5 Aerospace & defense equipment manufacturing
- 9.6 Metal & mining equipment
- 9.7 Power generation equipment
- 9.8 Food & beverage processing machinery
Chapter 10 Market Estimates & Forecast, By Distribution Channel, 2021 - 2034, (USD Billion) (Thousand Units)
- 10.1 Key trends
- 10.2 Direct
- 10.3 Indirect
Chapter 11 Market Estimates & Forecast, By Region, 2021 -2034 (USD Billion) (Thousand Units)
- 11.1 Key trends
- 11.2 North America
- 11.2.1 U.S.
- 11.2.2 Canada
- 11.3 Europe
- 11.3.1 UK
- 11.3.2 Germany
- 11.3.3 France
- 11.3.4 Italy
- 11.3.5 Spain
- 11.4 Asia Pacific
- 11.4.1 China
- 11.4.2 Japan
- 11.4.3 India
- 11.4.4 South Korea
- 11.4.5 Australia
- 11.5 Latin America
- 11.5.1 Brazil
- 11.5.2 Mexico
- 11.6 MEA
- 11.6.1 South Africa
- 11.6.2 Saudi Arabia
- 11.6.3 UAE
Chapter 12 Company Profiles (Business Overview, Financial Data, Product Landscape, Strategic Outlook, SWOT Analysis)
- 12.1 Bruel & Kjar
- 12.2 Emerson Electric Co.
- 12.3 Fluke Corporation
- 12.4 General Electric (GE)
- 12.5 Honeywell International Inc.
- 12.6 Kistler Group
- 12.7 Meggitt PLC
- 12.8 National Instruments
- 12.9 PCB Piezotronics
- 12.10 Pruftechnik
- 12.11 Rockwell Automation
- 12.12 Schaeffler Technologies AG
- 12.13 Siemens AG
- 12.14 SKF
- 12.15 SPM Instrument AB

