
PUBLISHER: Global Market Insights Inc. | PRODUCT CODE: 1740951

PUBLISHER: Global Market Insights Inc. | PRODUCT CODE: 1740951
PEF (Polyethylene Furanoate) Market Opportunity, Growth Drivers, Industry Trend Analysis, and Forecast 2025 - 2034
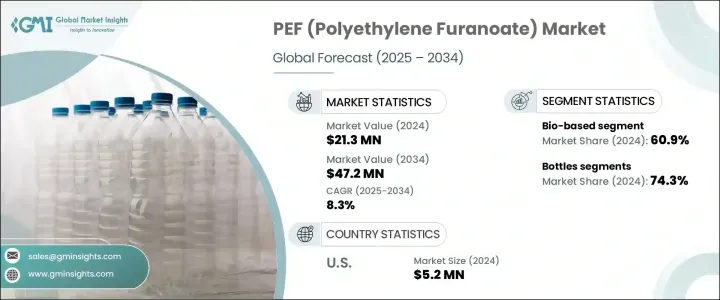
The Global PEF (Polyethylene Furanoate) Market was valued at USD 21.3 million in 2024 and is estimated to grow at a CAGR of 8.3% to reach USD 47.2 million by 2034. PEF is a next-generation, bio-based polyester derived from renewable feedstocks, primarily derived from plant-based sugars. As an eco-friendly alternative to traditional petroleum-based plastics, such as polyethylene terephthalate (PET), PEF has been gaining significant traction due to the increasing consumer and regulatory shift toward sustainability. The market growth is largely fueled by the rising demand for environmentally friendly packaging solutions, stricter regulations aimed at reducing plastic waste, and the inherent material properties of PEF, which offer superior advantages over conventional plastics like PET.
The growing global push toward sustainable packaging is one of the key factors driving the expansion of the PEF market. Consumers, companies, and governments alike are increasingly focused on reducing the environmental footprint of packaging, and PEF, derived from renewable plant sources, offers a promising solution. This polyester not only reduces the carbon footprint compared to traditional plastics but also contributes to less waste accumulation, as PEF is biodegradable. Moreover, its superior barrier properties, which include better resistance to oxygen, carbon dioxide, and water vapor compared to PET, make it particularly valuable in sectors such as food and beverage packaging, where product quality and shelf life are crucial.
| Market Scope | |
|---|---|
| Start Year | 2024 |
| Forecast Year | 2025-2034 |
| Start Value | $21.3 Million |
| Forecast Value | $47.2 Million |
| CAGR | 8.3% |
As demand for PEF continues to rise, the market is seeing increased interest from companies across the globe. PEF bottles, in particular, have captured the largest share of the market, accounting for 74.3% of the overall PEF usage. This is due to PEF's advanced barrier capabilities, which preserve the freshness of beverages for longer periods. In the beverage industry, where product longevity is vital, the shift from traditional plastics to bio-based alternatives is not just a trend but a necessity. Furthermore, the growing consumer awareness surrounding environmental sustainability is pushing beverage manufacturers to adopt these more eco-friendly materials. With governments enforcing stricter regulations on plastic waste and carbon emissions, major corporations in the beverage industry are making the switch to bio-based plastics like PEF.
The global PEF market is also divided into two primary categories: bio-based and plant-based sources. The bio-based segment is dominant, holding a 60.9% share in 2024, thanks to the versatility of bio-based feedstocks. Unlike plant-based sources, which often rely on specific crops, bio-based production methods allow manufacturers to use a wide range of raw materials, such as agricultural byproducts, industrial residues, and sugar-rich biomass. This flexibility not only secures supply chains but also strengthens the scalability and resilience of PEF production, ensuring its continued growth as demand increases.
The United States is a significant player in the PEF market, generating USD 5.2 million in 2024. A major driver of this growth has been government initiatives that support the adoption of bio-based materials. Programs designed to promote the use of renewable plastics, particularly through federal procurement mandates, have created a favorable landscape for PEF. These initiatives not only help reduce the environmental impact but also open up opportunities for PEF across diverse applications, including packaging, textiles, and films. By fostering an environment conducive to the growth of sustainable plastics, the U.S. is establishing itself as a leader in the global shift toward eco-friendly materials.
To capitalize on this rapidly growing market, key players in the PEF sector are employing a range of strategies, including expanding their production capacities, forming strategic partnerships with other industry leaders, and investing heavily in research and development to improve PEF production methods and enhance its material properties. Companies such as BASF SE, Avantium, Amcor, Alpla Group, and Toyobo are at the forefront of this innovation, positioning themselves as key players in the eco-friendly packaging market. By embracing sustainable solutions and leveraging government incentives, these companies aim to stay ahead of the curve in the fast-evolving packaging industry.
Table of Contents
Chapter 1 Methodology & Scope
- 1.1 Market scope & definition
- 1.2 Base estimates & calculations
- 1.3 Forecast calculation
- 1.4 Data sources
- 1.4.1 Primary
- 1.4.2 Secondary
- 1.4.2.1 Paid sources
- 1.4.2.2 Public sources
- 1.5 Primary research and validation
- 1.5.1 Primary sources
- 1.5.2 Data mining sources
Chapter 2 Executive Summary
- 2.1 Industry synopsis, 2021-2034
Chapter 3 Industry Insights
- 3.1 Industry ecosystem analysis
- 3.1.1 Key manufacturers
- 3.1.2 Distributors
- 3.1.3 Profit margins across the industry
- 3.1.4 Supply disruptions
- 3.2 Trump administration tariffs
- 3.2.1 Impact on trade
- 3.2.1.1 Trade volume disruptions
- 3.2.1.2 Retaliatory measures
- 3.2.2 Impact on the industry
- 3.2.2.1 Supply-side impact (raw materials)
- 3.2.2.1.1 Price volatility in key materials
- 3.2.2.1.2 Supply chain restructuring
- 3.2.2.1.3 Production cost implications
- 3.2.2.2 Demand-side impact (selling price)
- 3.2.2.2.1 Price transmission to end markets
- 3.2.2.2.2 Market share dynamics
- 3.2.2.2.3 Consumer response patterns
- 3.2.2.1 Supply-side impact (raw materials)
- 3.2.3 Key companies impacted
- 3.2.4 Strategic Industry Responses
- 3.2.4.1 Supply Chain Reconfiguration
- 3.2.4.2 Pricing and Product Strategies
- 3.2.4.3 Policy Engagement
- 3.2.5 Outlook and Future Considerations
- 3.2.1 Impact on trade
- 3.3 Trade statistics (HS Code)
- 3.3.1 Major Exporting Countries
- 3.3.2 Major Importing Countries
- 3.4 Profit margin analysis
- 3.5 Key news & initiatives
- 3.6 Regulatory landscape
- 3.7 Impact forces
- 3.7.1 Growth drivers
- 3.7.1.1 Rising global demand for sustainable and bio-based packaging materials
- 3.7.1.2 Increasing regulatory pressure to reduce plastic waste and carbon emissions
- 3.7.1.3 High performance properties of PEF compared to PET, such as better barrier resistance and mechanical strength
- 3.7.2 Industry pitfalls & challenges
- 3.7.2.1 Dependency on feedstock availability such as fructose-derived 2,5-Furandicarboxylic acid (FDCA)
- 3.7.2.2 Competition from other bio-based polymers such as PLA and bio-PET
- 3.7.1 Growth drivers
- 3.8 Growth potential analysis
- 3.9 Porter's analysis
- 3.10 PESTEL analysis
Chapter 4 Competitive Landscape, 2024
- 4.1 Introduction
- 4.2 Company market share analysis
- 4.3 Competitive positioning matrix
- 4.4 Strategic outlook matrix
Chapter 5 Market Estimates and Forecast, By Source, 2021-2034 (USD Million) (Kilo Tons)
- 5.1 Key trends
- 5.2 Plant based
- 5.3 Bio-based
Chapter 6 Market Estimates and Forecast, By Application, 2021-2034 (USD Million) (Kilo Tons)
- 6.1 Key trends
- 6.2 Bottles
- 6.3 Fibres
- 6.4 Film
- 6.5 Others
Chapter 7 Market Estimates and Forecast, By End Use Industry, 2021-2034 (USD Million) (Kilo Tons)
- 7.1 Key trends
- 7.2 Packaging
- 7.3 Textiles
- 7.4 Electronics
- 7.5 Pharmaceuticals
- 7.6 Others
Chapter 8 Market Estimates and Forecast, By Region, 2021-2034 (USD Million) (Kilo Tons)
- 8.1 Key trends
- 8.2 North America
- 8.2.1 U.S.
- 8.2.2 Canada
- 8.3 Europe
- 8.3.1 Germany
- 8.3.2 UK
- 8.3.3 France
- 8.3.4 Spain
- 8.3.5 Italy
- 8.3.6 Netherlands
- 8.4 Asia Pacific
- 8.4.1 China
- 8.4.2 India
- 8.4.3 Japan
- 8.4.4 Australia
- 8.4.5 South Korea
- 8.5 Latin America
- 8.5.1 Brazil
- 8.5.2 Mexico
- 8.5.3 Argentina
- 8.6 Middle East and Africa
- 8.6.1 Saudi Arabia
- 8.6.2 South Africa
- 8.6.3 UAE
Chapter 9 Company Profiles
- 9.1 Alpla Group
- 9.2 Amcor
- 9.3 AVA Biochem
- 9.4 Avantium
- 9.5 BASF SE
- 9.6 Origin Materials
- 9.7 Sulzer
- 9.8 Swicofil
- 9.9 Toyobo

